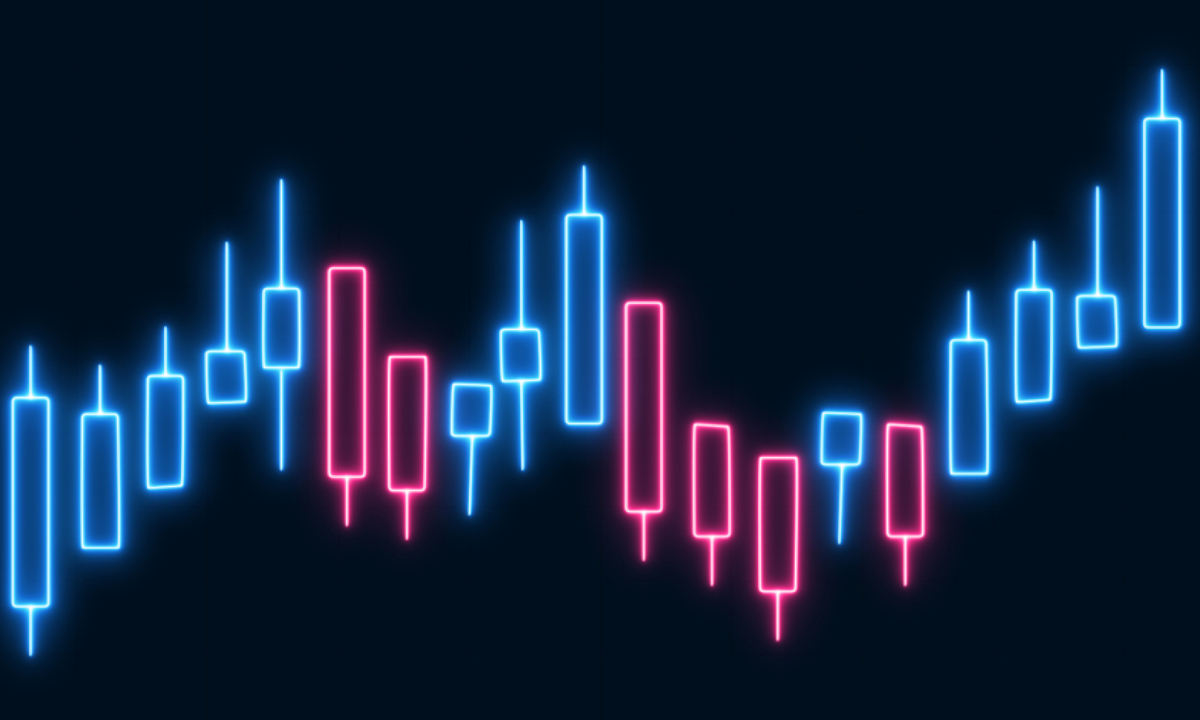
Chart readings from a user on X placed attention on the Cardano price prediction outlook after ADA moved toward a narrow support band on the 4-hour timeframe. The token traded near levels tracked through the week, while traders monitored lower zones for directional cues. The post shared by the user on X presented the latest structure and outlined areas that could guide short-term movement. The update added fresh context for the broader market and formed part of ongoing ada predictions across trading channels.
Finora AI reported that traded around $0.4101, close to a range where buyers reacted in earlier sessions. The chart identified a recent swing high at $0.4842 and a lower boundary near $0.4035. This placed the market within a compact frame as traders assessed whether the level could stabilize short-term moves. The model observed that ADA hovered above $0.4057, which served as a demand area in prior trading.

Source: X/@FinoraAI_PT
The Cardano price prediction outlook remained focused on this zone. Trading participants evaluated whether the support band would hold or if sellers would push the coin toward lower targets. The broader graph on multiple timeframes showed slowing momentum near the boundary, which kept attention on close-range structure while traders awaited confirmation.
The tweet outlined two lower targets if ADA slipped below the monitored range. The account marked $0.3830 and $0.3707 as areas that formed support during past exchange phases. These levels aligned with wider crypto value analysis models that tracked liquidity pockets in earlier trading.

Source: CoinMarketCap
Graph behavior showed repeated tests of $0.4057 as the market approached the zone without forming strong recoveries. This kept short-term sentiment neutral while analysts observed whether coin movement would break lower or form a shift in structure. The predictions shared across crypto communities continued to reference the same areas, adding consistency to exchange expectations.
Finora AI also outlined upside targets if held its current zone. The model placed $0.4293 as an early resistance level, followed by $0.4558 and $0.4842. These levels formed part of earlier reaction points across the graph, and they shaped the Cardano price prediction outlook on the recovery side.
Exchange activity during the previous weeks produced several reactions around these prices. Traders tracked these points as part of near-term structure. The update from Finora AI advised caution until clear reversal patterns appeared on the 4-hour chart. The model pointed to formations such as a pin bar or a bullish engulfing close as signals to watch within the demand range.
Disclaimer: This analysis is based on market trends and does not guarantee future results. It should not be treated as financial advice. Cryptocurrency investments involve risk, so always do your own research (DYOR) before investing.

Shristy Malviya is a skilled English Blog Writer and Content Writer associated with Coin Gabbar, specializing in producing well-researched and SEO-friendly content on cryptocurrency, blockchain innovation, and financial technology. She is passionate about making complex industry topics accessible and valuable to a wide audience. Shristy’s work reflects her commitment to delivering credible and high-quality information that aligns with current market trends. Outside her writing career, she enjoys reading books, an activity that deepens her understanding of global markets and continuously inspires her professional growth.
Shristy Malviya is a skilled English Blog Writer and Content Writer associated with Coin Gabbar, specializing in producing well-researched and SEO-friendly content on cryptocurrency, blockchain innovation, and financial technology. She is passionate about making complex industry topics accessible and valuable to a wide audience. Shristy’s work reflects her commitment to delivering credible and high-quality information that aligns with current market trends. Outside her writing career, she enjoys reading books, an activity that deepens her understanding of global markets and continuously inspires her professional growth.


Owned by:-
DCG Tech FZCO, UAE
Delivery Partner:-
Gabbar MediaTech Pvt Ltd.
Copyright © 2025 Coin Gabbar. All Rights Reserved.