Dogecoin moved toward a key trading zone as participants tracked new activity across the crypto space. Data from TradingView showed the token near the $0.136 level after a steady decline. Social data also shaped attention around Doge price prediction trends. A post from the X account @dogegod stated that Dogecoin recorded more than $3.4 billion in 24-hour trading volume. Traders observed this activity as broader discussions grew across the crypto price prediction space.
The chart placed DOGE near a support area where earlier reactions formed. Chart watchers also studied volume changes, structure shifts, and trading behavior to understand the next stage of movement.
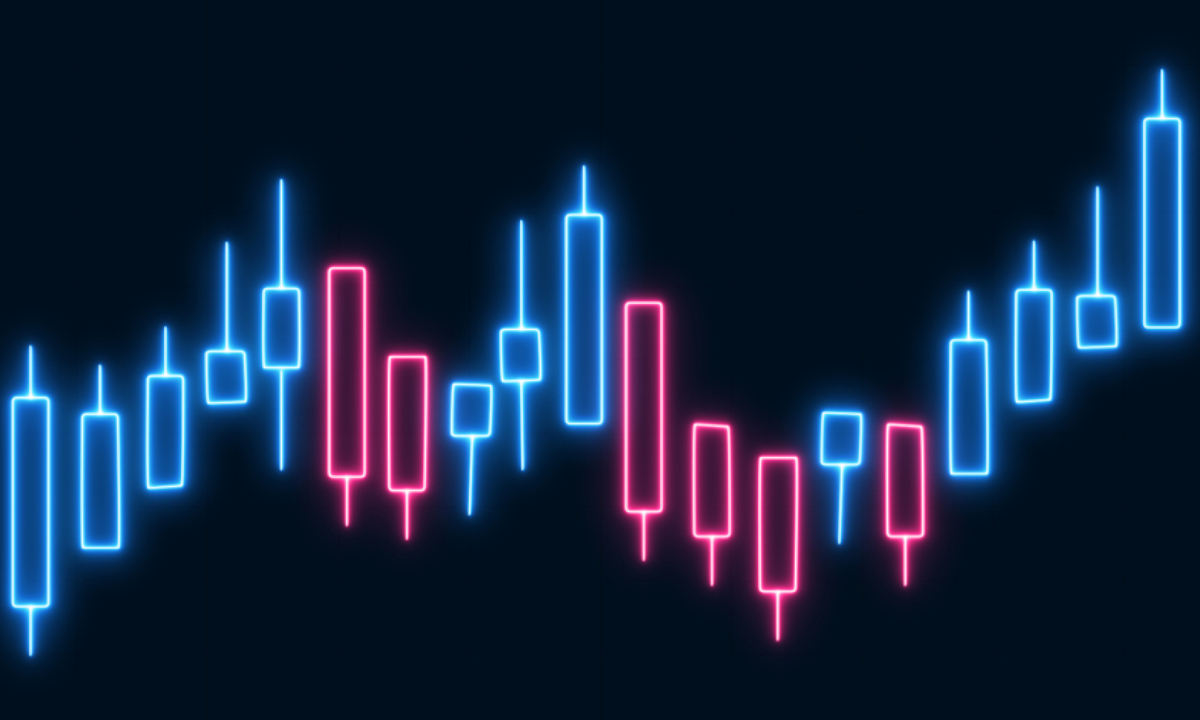
A wider analysis of the daily chart showed lower highs and lower lows. This structure shaped the recent phase of movement. The coin moved away from the October range and approached the $0.13 region, where price flattened across several sessions. The candles formed small bodies and short wicks, which showed tighter movement near support.

Source: TradingView
The $0.15 zone limited the most recent upward attempt. Sellers controlled that region and pushed the market lower again. Another lower area sits near $0.12, where it reversed during earlier market cycles. A broader support range remains at $0.10, where longer consolidation formed in past trading periods.
Traders follow these areas as part of a wider DOGE technical outlook, since structure and quantity shifts often shape expectations around future movement.
The tweet from @dogegod added context to the latest update. The post reported a surge in Dogecoin trading volume, which crossed $3.4 billion in one day. This activity appeared while price moved lower, and participants monitored how volume behaved near the current trading zone.
The chart showed sharp candles during earlier sessions, including one with a long downward wick. Moves like this appear often during high activity phases. Traders use this information for DOGE chart analysis as they study reactions at each area.
Quantity expanded while the coin approached the support region. This shift aligned with stronger trading behavior and higher participation from both sides. Market participants often track volume near major levels since these shifts can shape movement within the next trading phase.
A broader Dogecoin forecast shows the coin under a descending trendline that limits upward movement.

Source: TradingView
The chat tried to move above $0.15 but failed during several sessions. Another key region sits near $0.18, where price rejected earlier attempts to advance.
It now trades inside a zone that shaped earlier measurements of strength and weakness. Support levels, resistance points, and rising participation continue to shape the current Doge price prediction cycle. Traders also follow structure changes across the broader crypto price prediction landscape as the market prepares for the next move.

Shristy Malviya is a skilled English Blog Writer and Content Writer associated with Coin Gabbar, specializing in producing well-researched and SEO-friendly content on cryptocurrency, blockchain innovation, and financial technology. She is passionate about making complex industry topics accessible and valuable to a wide audience. Shristy’s work reflects her commitment to delivering credible and high-quality information that aligns with current market trends. Outside her writing career, she enjoys reading books, an activity that deepens her understanding of global markets and continuously inspires her professional growth.
Shristy Malviya is a skilled English Blog Writer and Content Writer associated with Coin Gabbar, specializing in producing well-researched and SEO-friendly content on cryptocurrency, blockchain innovation, and financial technology. She is passionate about making complex industry topics accessible and valuable to a wide audience. Shristy’s work reflects her commitment to delivering credible and high-quality information that aligns with current market trends. Outside her writing career, she enjoys reading books, an activity that deepens her understanding of global markets and continuously inspires her professional growth.


Owned by:-
DCG Tech FZCO, UAE
Delivery Partner:-
Gabbar MediaTech Pvt Ltd.
Copyright © 2025 Coin Gabbar. All Rights Reserved.