Data watchers continue to examine Doge’s movement after data that was shared by a user on X suggested an extended collection phase for the token. The post gained attention because it compared the current form with earlier periods that came before large market swings. The data on X showed three major accumulation stages over the years and placed the ongoing one as the longest. People also reviewed the coin’s daily graph, which displays a steady decline from late September. These two views created broader discussions about the next Dogecoin value forecast and how it fits into wider crypto price analysis models.
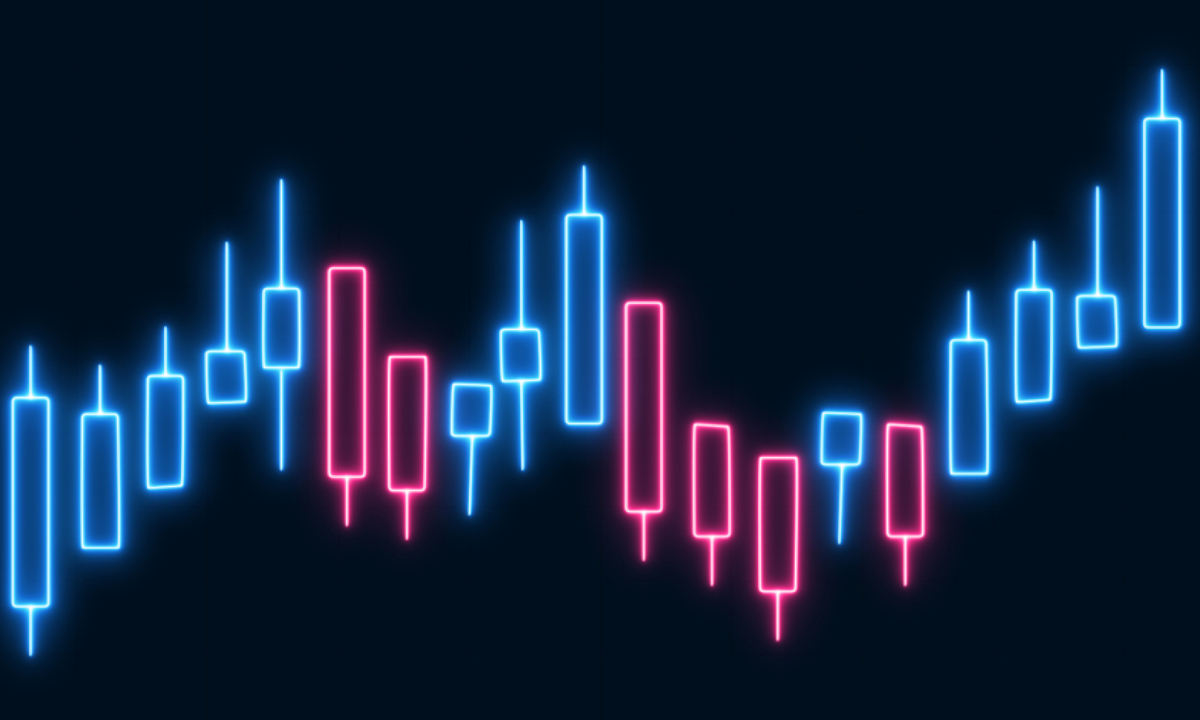
The coin’s daily chart reveals consistent lower highs and lower lows. The token trades around the $0.13 mark, which forms part of a support band watched by traders. The $0.15 to $0.16 zone acts as the first resistance area on the short-term form.

Source: TradingView
Participants monitor these levels to adjust their doge value forecast outlook based on graph behaviour. The drop from October’s peak continued into November, and people noted a large intraday wick that formed during a rapid sell-off. The market absorbed the move without reversing the broader trend, which kept the focus on the lower form.
The weekly chart presents a different picture. GalaxyBTC’s map suggests rising accumulation zones over several years, where the base level moves upward over long stretches. Earlier collection phases preceded substantial moves for the token. Analysts track this pattern to determine the next Dogecoin Price Prediction path. The ongoing phase has lasted longer than previous ones shown on the graph, which has drawn attention from users following long-term behaviour.

Traders observe several support levels between $0.13 and $0.12. The $0.10 region stands as a stronger level based on earlier reactions. Any move above $0.15 may shift attention to the $0.18 to $0.20 zone. These levels align with common crypto value analysis models that rely on trend changes and structure breaks. Traders look for a higher low to form above current levels, which would suggest a stronger base. The present structure still leans toward a downward trend.
GalaxyBTC’s post on X added context to the debate around Dogecoin Price Prediction. The extended accumulation pattern on the weekly chart shows a rising base across several cycles. Earlier examples on the graph came before strong market phases for the token. Observers now track whether the current range will lead to similar behaviour. The discussion around the tweet and the daily structure of the map continues to shape the broader doge rate analysis narrative in the market.

Shristy Malviya is a skilled English Blog Writer and Content Writer associated with Coin Gabbar, specializing in producing well-researched and SEO-friendly content on cryptocurrency, blockchain innovation, and financial technology. She is passionate about making complex industry topics accessible and valuable to a wide audience. Shristy’s work reflects her commitment to delivering credible and high-quality information that aligns with current market trends. Outside her writing career, she enjoys reading books, an activity that deepens her understanding of global markets and continuously inspires her professional growth.
Shristy Malviya is a skilled English Blog Writer and Content Writer associated with Coin Gabbar, specializing in producing well-researched and SEO-friendly content on cryptocurrency, blockchain innovation, and financial technology. She is passionate about making complex industry topics accessible and valuable to a wide audience. Shristy’s work reflects her commitment to delivering credible and high-quality information that aligns with current market trends. Outside her writing career, she enjoys reading books, an activity that deepens her understanding of global markets and continuously inspires her professional growth.


Owned by:-
DCG Tech FZCO, UAE
Delivery Partner:-
Gabbar MediaTech Pvt Ltd.
Copyright © 2025 Coin Gabbar. All Rights Reserved.