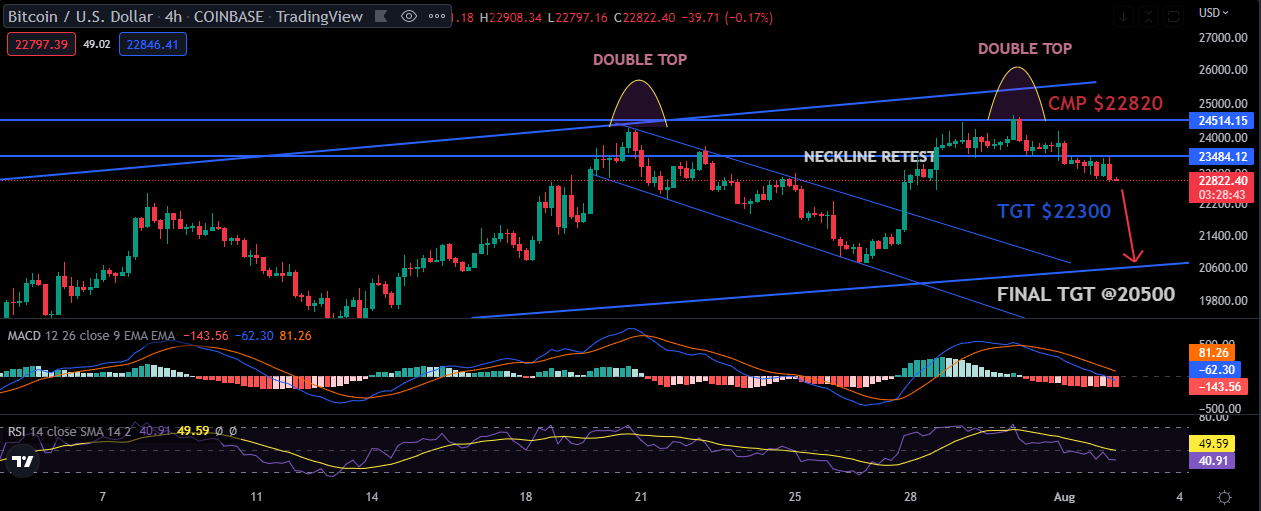
the US Dollar, Bitcoin is displaying a few bearish indicators. The $22,000 support level may be tested as BTC continues to decline.
The price of bitcoin was unable to begin a new uptrend over the $24,000 resistance level. Price initiated a new downward movement and came to rest below the $23,500 support region.
The upward movement from the $20,695 swing low to $24,670 high was clearly below the 23.6 percent Fib retracement level. Below the $23,500 mark and the 100 hourly simple moving average, the price is currently displaying bearish indicators.
On the hourly chart of the BTC/USD pair, a significant negative trend line with resistance near $23,300 is also developing. The recent price movement indicates that bitcoin may continue to decline, with a near-term support level of $22,800.
On the upside, the price is bumping up against resistance near the trend line and the $23,300 mark. Near the $23,750 area and the 100 hourly simple moving average comes the next significant obstacle.
The $24,000 area can present the most barrier. A close over the $24,000 barrier level could start a new uptrend. In the aforementioned scenario, the cost might increase to around $24,500. The next significant barrier is located close to the $25,000 mark.
Bitcoin may continue to decline if the $23,300 resistance area is not overcome. Near the $22,800 mark, there is immediate support on the downside.
The area around $22,680 now serves as the next significant support. It is quite close to where the upward movement from the swing low of $20,695 to the high of $24,670 is being retraced at 50%. Any additional losses could push the price up to $22,000.
KEY LEVELS :
RESISTANCE LEVEL : $23200-$23800
SUPPORT LEVEL : $22600-$22000