Cardano Price Prediction as ADA Tests Market Support Zones
Cardano Price Prediction Outlook as ADA Reacts to Resistance Pressure
Cardano faced renewed market pressure as traders reviewed fresh chart data and liquidation figures shared on social media. ADA slipped toward short-term support after failing at a key Fibonacci level, while liquidation metrics showed large long-side exposure. The update shaped the broader Cardano price prediction outlook for market participants tracking short-term movements and overall trend conditions. A commentary post from X user added context by noting the rejection near a resistance band and the effect on bullish positioning.
Exchange Reaction After Resistance Zone Failure
The coin moved lower after cost action rejected the 0.236 Fibonacci level at $0.447. The move placed attention on short-term behavior and created interest in new support tests. Data from the provided graph showed a clear shift from an attempted recovery to renewed selling pressure. The pattern aligned with a multi-week sequence of lower highs on the higher time frames.

Source: X/@cryptsnews
Moreover, traders monitored the impact of liquidations. Data showed $2.24 million liquidated during the past 24 hours, with long positions accounting for most of the losses.

Source: X/@cryptsnews
The update offered a reference point for exchange positioning and helped shape near-term ada predictions. The liquidation surge confirmed the presence of leveraged exposure near the latest resistance test.
Coin Behavior Across Lower Time Frames
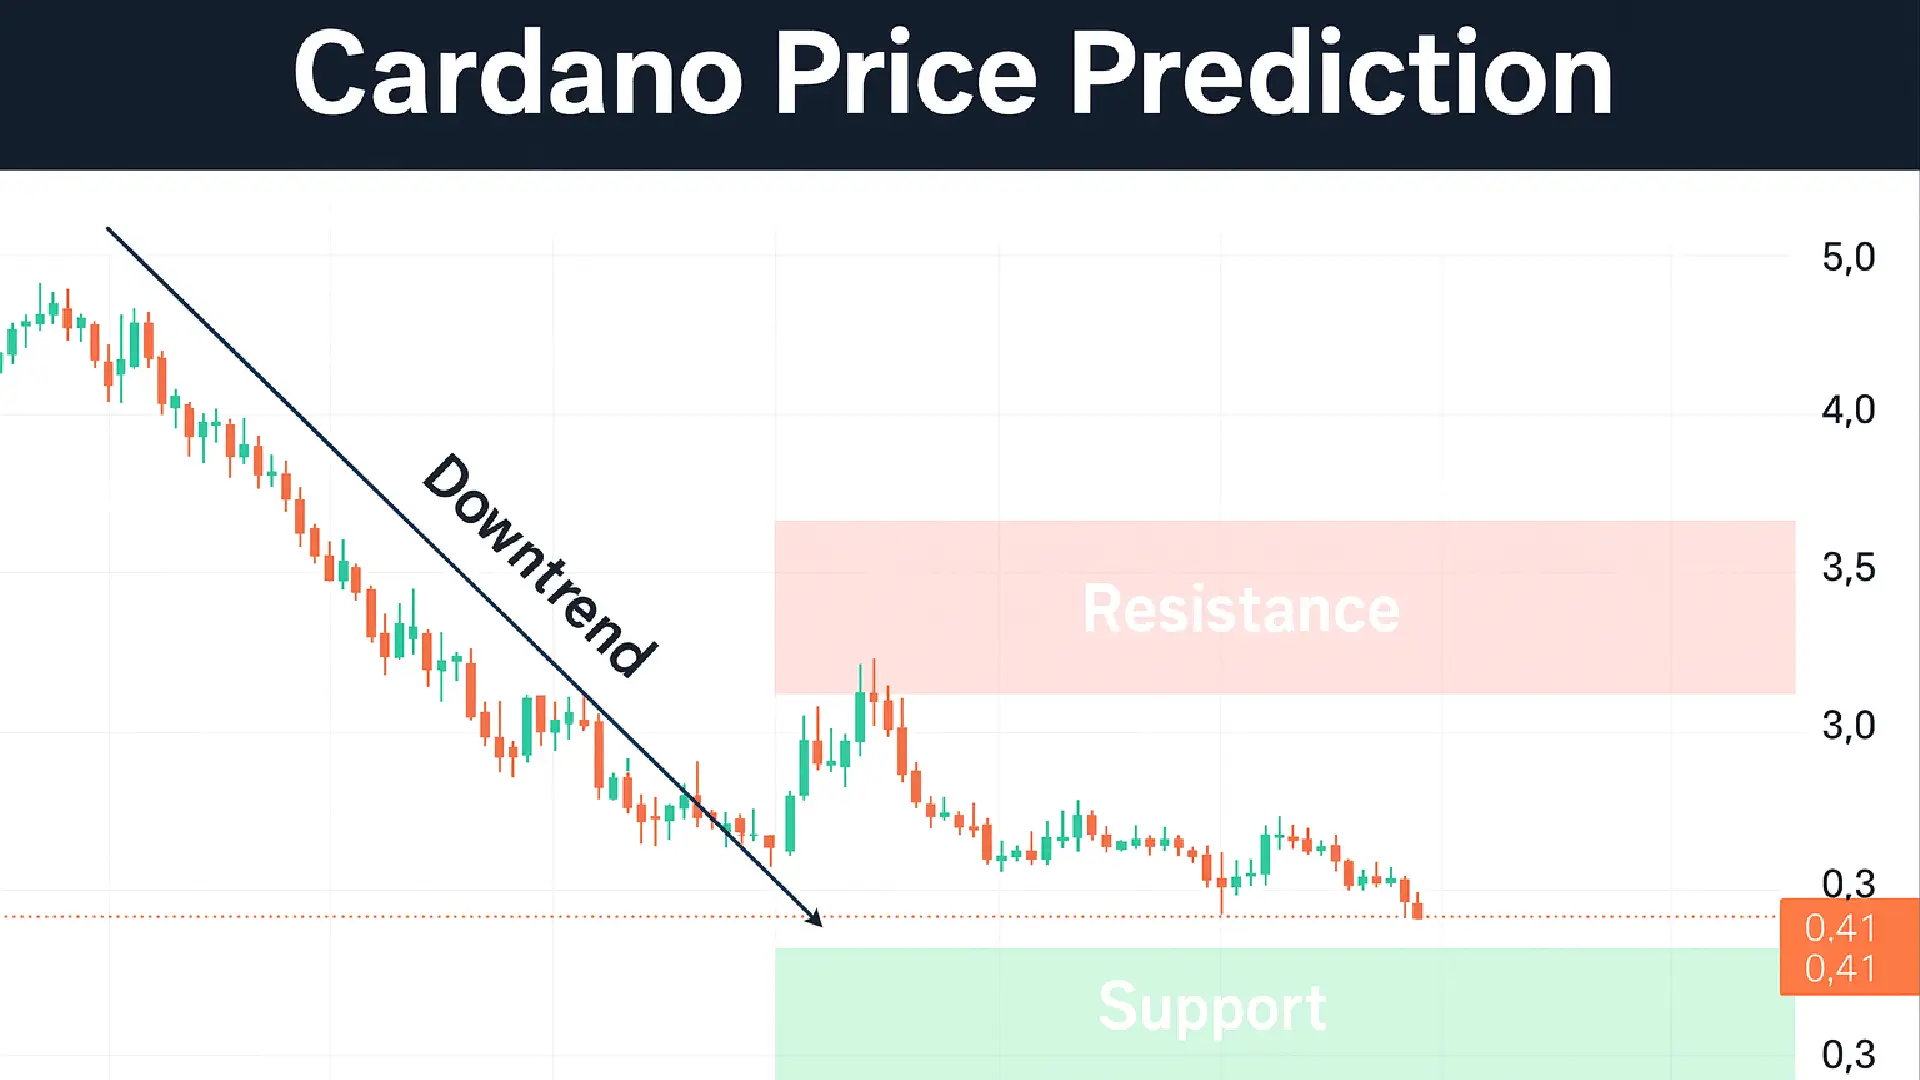
The TradingView chart revealed a gradual trend lower from early October through late November. Cost action formed a series of lower lows and showed little sustained recovery during that period. The visual pattern pointed to a controlled decline until ADA reached the $0.37 zone.

Source: TradingView
From late November into December, the chart displayed a narrow range between $0.40 and $0.48. This period offered relief for the market, yet the upper level remained firm. The latest rejection occurred near the top of that range. The update from @cryptsnews noted this rejection and observed that sellers remained active near the supply level. The post also raised questions on direction as people assessed conditions.
Short-Term Levels Monitored by Traders
Current analysis places attention on the $0.40 to $0.41 support band. A move below this range may guide the next phase of trading activity. This area also connects with prior reactions seen on the chart during late November.
Meanwhile, the ceiling region between $0.447 and $0.48 remains the key area for any potential recovery. A close above that band may shift the provisional Cardano price prediction outlook. However, traders continue to refer to broader exchange structures when forming new crypto price prediction models.
Disclaimer: This analysis is based on market trends and does not guarantee future results. It should not be treated as financial advice. Cryptocurrency investments involve risk, so always do your own research (DYOR) before investing.