Binance Coin Price Prediction: Breakout or Bearish Decline?


Binance Coin Price Prediction: Bullish Reversal or Fake Breakout?
V-Shaped Recovery & Formation of Inverted Head and Shoulders:
Over the past three weeks, BNB has demonstrated a sharp V-shaped recovery, rising from $471.3 to $596.30, marking a 26.40% increase.
On the daily chart, this recovery contributed to the formation of an inverted head and shoulders pattern, a classic bullish reversal signal.
Breakout from Key Neckline Resistance:
On September 23rd, Binance Coin broke through a key neckline resistance at around $600, confirming the bullish reversal pattern.
A bullish crossover between the 50-day and 100-day EMAs further strengthens the bullish outlook, indicating continued upward momentum.
Support from CEO News:
The anticipated release of former Binance CEO Changpeng Zhao adds to the positive sentiment, enhancing the bullish narrative for BNB.
Bearish Scenario and Retest of Trendline:
Despite the breakout, if BNB retests and falls below the trendline, bearish momentum could return. This could potentially drive the price back down to $525, reversing the current bullish setup.
Bearish Triple-Top and Evening Star Candlestick Patterns:
Despite the recent 25% rally, Binance Coin now shows signs of weakness. A concerning development is the formation of a bearish triple-top pattern, typically seen as a negative indicator by investors.
Compounding this bearish sentiment is the appearance of a bearish evening star candlestick pattern near the $605 resistance level, signaling a potential trend reversal from bullish to bearish.
Potential Price Decline and Resistance Levels:
Given historical price trends, BNB may decline by up to 18%, possibly reaching $480 in the near future.
This bearish outlook is contingent on BNB staying below the $620 resistance level. Should the price surpass $620, the downtrend scenario may not unfold, and BNB could maintain its bullish trend.
This analysis indicates that BNB is at a critical juncture, with both bullish and bearish factors influencing its next moves. Traders should closely monitor the $620 level and the evening star pattern for confirmation of the upcoming trend.
BNB’s Bearish On-chain Metrics
Besides this technical analysis, the current negative outlook is further supported by on-chain metrics. According to the on-chain analytics firm Coinglass, BNB’s Long/Short ratio currently stands at 0.9153, the lowest since August 27, 2024. This indicates a strong bearish sentiment among traders.
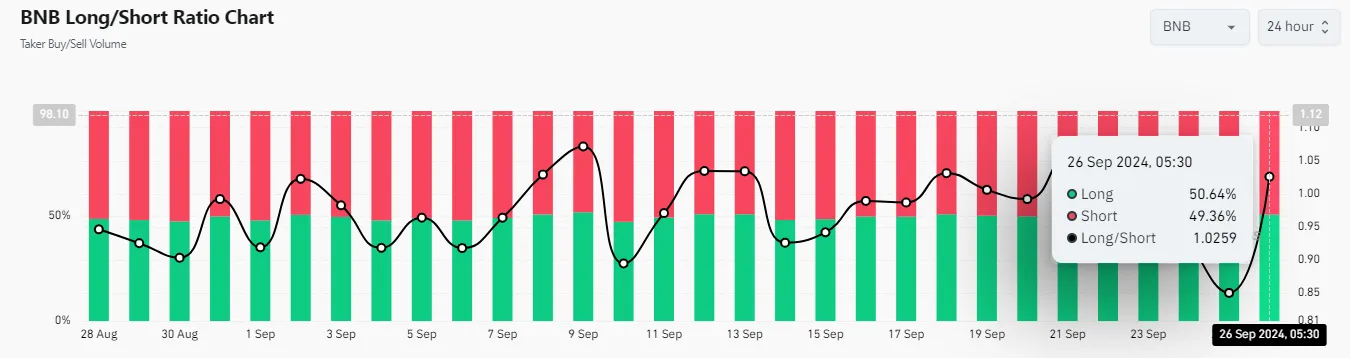 Source: Coinglass
Additionally, The Volume declined by 17.08% and its interest declined by 7% in the last 24 hours, indicating growing fear among traders, likely due to the bearish price action pattern. Currently, 49.36% of top traders hold short positions, while 50.64% hold long positions.
While combining all of BNB’s on-chain metrics with its price action, it appears that bears are dominating the assets and may cause a significant price decline in the coming days.
Also Read: Hamster Kombat Price Prediction: How Much Is 1 HMSTR in USD?
















