Bitcoin, Ethereum Solana XRP price prediction, CLARITY Act Rally


Why are Bitcoin, Ethereum, XRP, and Solana Prices Up Today?
This Bitcoin Ethereum Solana XRP price prediction examine show the CLARITY Act, institutional inflows, and technical indicators are shaping the outlook for the four largest cryptocurrencies.
As of 15th May, thetotal crypto market cap is up by 0.33% to $2.67 trillion. Bitcoin is sittingright at a critical support zone. It has already broken out of a majorresistance.
Ethereum has an unfilled CME gap staring it in the face. AndSolana is coiling up for what could be a massive breakout.
Add to that a landmark crypto regulation bill clearing the USSenate and suddenly, every signal is pointing in the same direction.
What Is Pushing Crypto Prices Up Today?
Two major catalysts hit the market at the same time.
The CLARITY Act cleared the Senate Banking Committee by a 15–9 vote. Two Democrats joined Republicans to push the bill forward. This matters because clear, fair crypto regulation is something the industry has needed for years.
When big institutions see clear rules, they bring big money. That is exactly what is happening right now.
At the same time, CME Group — the world's top derivatives exchange announced the Nasdaq CME Crypto Futures Index. This is their first-ever market-cap-weighted crypto futures product.
It covers Bitcoin, Ethereum, Solana, $XRP, Cardano, Chainlink, and Lumens. Institutional investors now have a regulated, clean way to bet on the crypto market as a whole. That is a game-changer.
Together, these two events are the fuel behind today's price surge across the entire crypto market.
Our analysis combines RSI, moving averages (EMA), trading volume, price structure and institutional market developments to estimateshort-term price targets for Bitcoin, Ethereum, XRP and Solana.
Bitcoin Price Prediction Today: BTC Hold $79,000 Support
Key Levels: Support at $79,000 | Target at $86,000 | Breakdown risk below $79K
Bitcoin has been moving inside an ascending channel since April 9. Every time BTC touched the lower support line of this channel, it bounced sharply. Here is the proof:
-
April 13: BTC bounced from $71,000 and surged 11% to $78,000
-
April 30: BTC held $75,000 and rallied 10.52% to $82,900
Right now, Bitcoin is testing that same support trend line around $79,000. If this floor holds once again, the next target is $86,000 — the top of the channel. BTC has also already reclaimed the $81,500 area, which is an early positive signal.
However, if $79,000 breaks, it would be a structural breakdown of the one-month trend. In that case, lower support zones come into the picture fast.
Bottom line: Hold above $79K = bullish. Lose $79K = caution needed.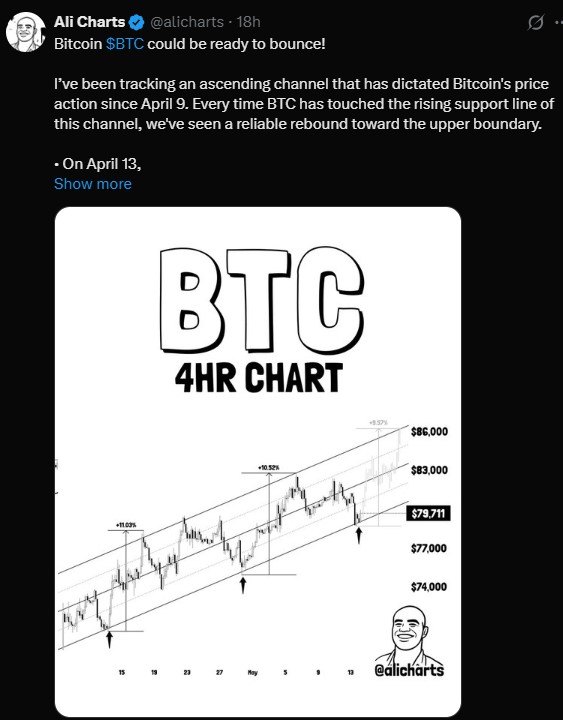
Ethereum Price Prediction: CME Gap at $2,641 Is the Target
Key Levels: Current price ~$2,267 | CME Gap zone $2,405–$2,641 | Long-term targets $5K, $8.5K, $12K
Ethereum has a well-known CME gap sitting between $2,405 and $2,641. Historically, CME gaps get filled almost every single time. That makes the $2,641 level a very realistic short-term target for ETH.
ETH already moved up roughly 1.5% today on the back of institutional news, which shows buyers are actively stepping in at these prices.
Looking further out, analyst Javon Marks (Source: @JavonTM1 on X) is tracking a wedge pattern on Ethereum's chart. His targets are $5,000, $8,500, and $12,000. These are longer-term goals, but the technical setup supports the thesis if momentum continues building.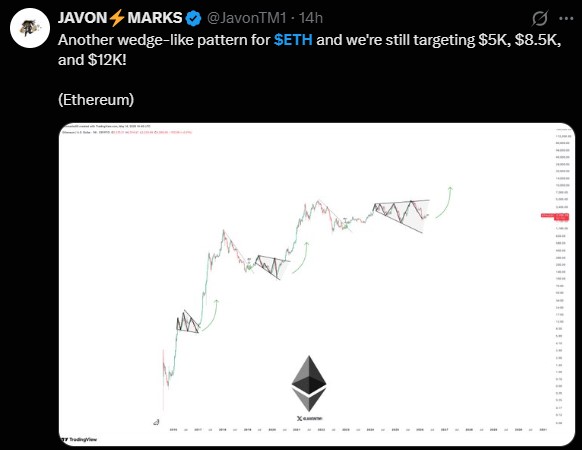
Bottom line: Watch $2,405 as the first target. A close above that opens the door to $2,641 quickly.
XRP Price Prediction Today: XRP Analysis Today Signals a Confirmed Breakout
Key Levels: support and resistance remain at $1.36 and $1.66 respectively, withhigher targets at $1.88 and $3.56 if momentum continues.
Today's technical analysis suggests the breakout hasalready begun after price moved above the $1.4746 resistance level. It already broke abovethe $1.4746 gateway resistance that analysts had been watching forweeks. According to technical analyst DarkDefender (Source: @DefendDark on X), three things confirmed this breakout:
The descending resistance line has been broken
The 3-day $XRP RSI has flipped bullish,indicating improving momentum after weeks of consolidation, showing improvingmomentum after weeks of consolidation.
Rising trading volume is supporting thebreakout, showing stronger buying participation.
It is also trading above its short-term moving averages, adding another layer ofconfirmation that the recent breakout is gaining strength. XRP is also tradingabove its short-term moving averages, adding another bullish confirmation tothe current breakout.
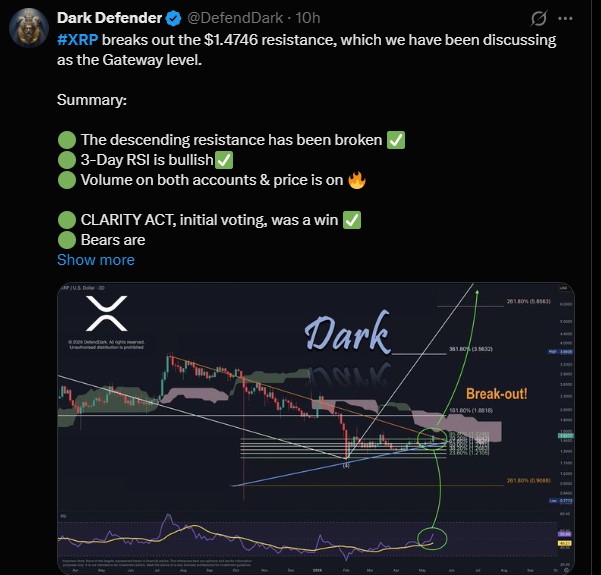
Withthe CLARITY Act acting as a fresh positive catalyst, the breakout has extra fuel behind it.
Bearsare on the back foot Investors are also monitoring the ETF approval impactand ETF flow trends, as institutional demand has become one of the biggestdrivers of XRP price expectations.
Thekey support and resistance levels now stand at $1.36 as immediate support,while $1.66, $1.88, $3.56, $5.85, and $8.76 remain the next major resistancetargets if bullish momentum continues.
These resistance zones also align with key XRP Fibonacci levels, making themimportant price areas to monitor for the next breakout.
Investorsare also closely monitoring XRP ETF flows, as institutional demand has becomeone of the strongest narratives influencing XRP price expectations during thecurrent market cycle.
These resistance zones also align closely with key Fibonacci levels, making themimportant areas where traders may expect increased buying or profit-takingactivity.
Key XRP support and resistance levels now stand at $1.36 and$1.66 respectively, with traders watching these zones closely for confirmationof trend continuation.
Growing XRP institutional adoption through cross-border paymentuse cases continues to support the token's longer-term investment thesis.
Bottom line: The latest XRP forecast remains bullish, with $1.66acting as the immediate upside target while support at $1.36 holds.
For investors searching for an XRP price prediction this week, maintaining supportabove $1.36 remains the most important signal to monitor. Many traders are alsoasking whether XRP will go up tomorrow.
Solana Price Prediction: $98 Breakout Could Trigger 20% Rally
Key Levels: Floor at $78 | Pivot at $88 | Ceiling at $98 | Breakout targets $107and $117
Since February, Solana has been moving inside a well-definedprice channel. The boundaries are clear $78 as the floor, $98 as the ceiling,and $88 as the midpoint pivot.
SOL recently got rejected at $98 but is now bouncing again fromlower levels. Analysts believe another retest of $98 is coming very soon. Hereis what to expect at that point:
-
Daily close above $98First target $107, second target $117
-
Rejection at $98 againPullback to $88 or full reset to $78
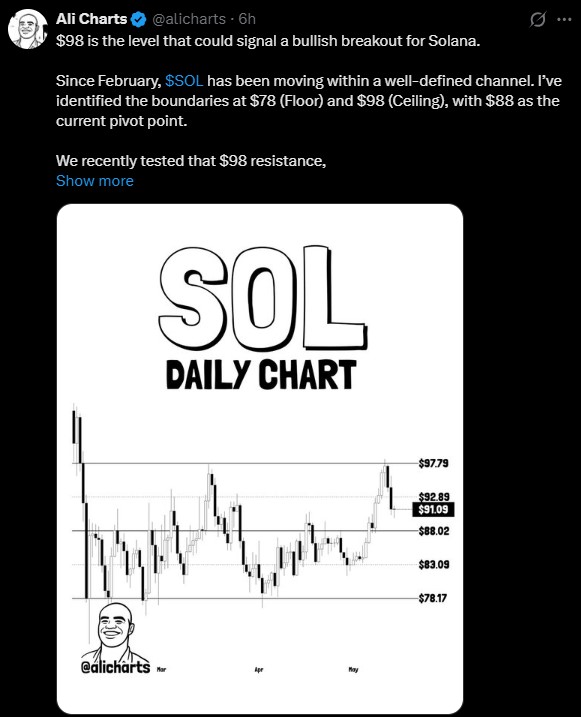
Bottom line: $98 is the single most important level for Solana right now. A confirmed breakout there changes everything.
CoinGlass Liquidation Data: What It Tells Us Right Now
According to CoinGlass (Source: coinglass.com), in the past 24 hours, 79,813 traders were liquidated for a combined total of $261.71 million.
Here is the important detail — short liquidations ($155.78M) were significantly higher than long liquidations ($105.93M). That means the market moved upward and squeezed out the sellers. Bulls are in control. The largest single liquidation was a $2.93 million order on Hyperliquid.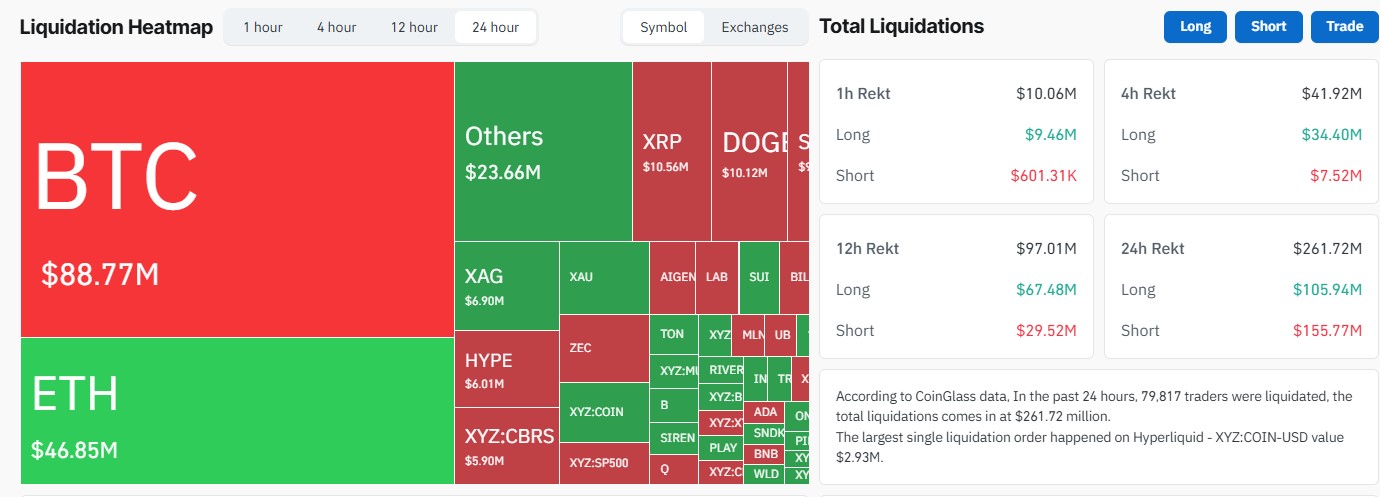
When shorts get wiped out at this scale, it tells you the market has genuine upward momentum — not just a slow drift higher.
Final Crypto Price Prediction Summary for Today
| Coin | Key Level to Watch | Bullish Target | Risk Level |
| Bitcoin (BTC) | $79,000 support | $86,000 | Medium |
| Ethereum (ETH) | $2,405 CME gap | $2,641 | Low–Medium |
| XRP | $1.66 next resistance | $1.88+ | Low (breakout confirmed) |
| Solana (SOL) | $98 breakout | $107–$117 | Medium |
Thecombination of the CLARITY Act moving forward in the Senate, CME Grouplaunching a major institutional crypto product, and strong technical setupsacross all four major coins creates a genuinely bullish environment.
Shortliquidations dominating the data add even more confidence to the bulls' case.
Based on current momentum indicators and price structure, XRP remains bullish rather than bearish while it continues trading above keysupport.
Nothingin crypto is ever 100% certain. However, the current technical setup not onlysupports today's outlook but also improves the longer-term XRP price prediction 2026 ifinstitutional demand and broader market momentum continue strengthening.
Is XRP a good buy right now? That depends on individual risktolerance, but the current technical setup remains constructive while supportlevels continue holding.
Overall, XRP appears bullish or bearish? Based on current priceaction, momentum indicators and trading volume, the short-term outlook remainscautiously bullish.
Disclaimer: This article is for informational purposes only and does not constitute financial advice. Cryptocurrency markets are highly volatile. Always do your own research and consult a qualified financial advisor before making any investment decisions.

















