- News
- Price Prediction
- Press Release
- Crypto Airdrop ›
- Presale / ICO ›
- Events
- Listing
- Tools ›
- Casino ›
-


Bitcoin price is currently trading near $110,700 after losing critical support at $112,000, which has now flipped into resistance. The shift indicates the decline of buyer momentum and proves that the short-term trend has been taken over by sellers.
The price had hit a ceiling twice before at around $124,000 and could not break above this level. Consequently, the market structure has been exhibiting a trend of lower highs and lower lows which is generally bearish.
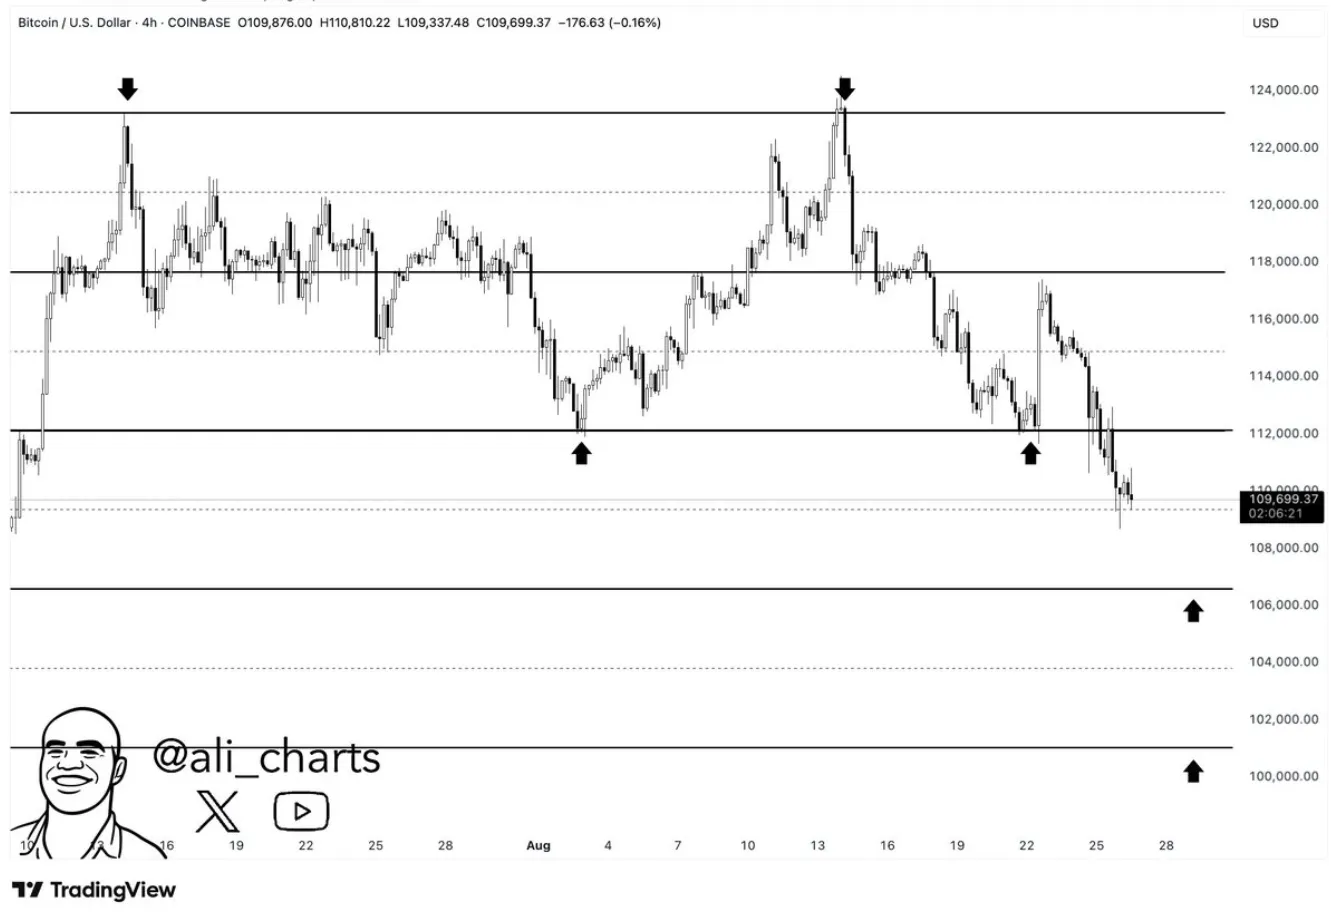
Bitcoin 4hr analysis: Source : X
Bitcoin price fell out of a consolidation channel and is currently testing near-term support at $109,000-$108,000. In case this zone is breached, the subsequent technical support levels are at $106,000 and $100,000.
Although the psychological level of $100,000 may attract buyers, a break below could trigger a faster decline. On the other hand, a hold may bring temporary relief, but the resistance is still strong above.
On the weekly time frame, the MACD indicator has generated a bearish crossover, which is also known as a death cross. This happens when the MACD line crosses below the signal line indicating that a trend may be reversing.
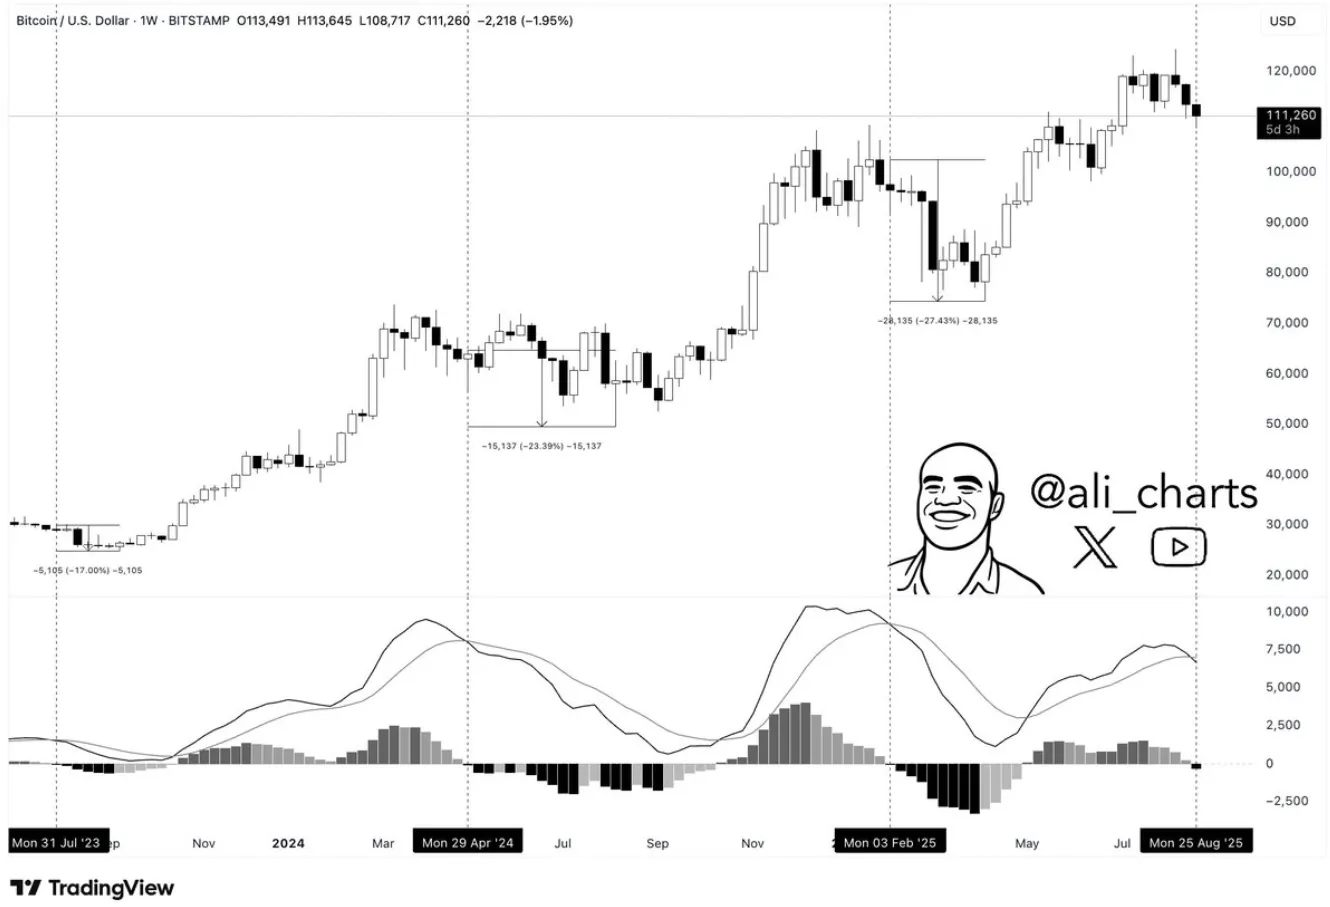
Bitcoin weekly analysis: Source : X
In the past, weekly MACD death crosses have been followed by extended bear markets and usually indicate the end of long-term momentum. As such, traders can take this formation as an indication that the uptrend might be losing its strength considerably.
CryptoQuant data shows that the 30-day moving average of Taker Buy/Sell Ratio (TBSR) is at the lowest point since May 2018. The figure has recently reached 0.95, which means that bearish selling is prevailing in most exchanges.
Bitcoin Taker Buy Sell Ratio : Source : CryptoQuant
When this ratio falls below 1.0, it indicates that sell orders in the market are overpowering buy-side demand. This pattern has been in the past accompanied by sharp declines, especially in 2018 and the middle of 2021.
The ratio is below 1.0, and as long as it is below 1.0, the likelihood of further downside is high. A recovery in this indicator above 1.02 would signal an improving sentiment, but that is not the case at this time.
The 7-day performance of Bitcoin price depicts a downward trend of 2.51%, which supports the position that the selling pressure is still present. Although the 24-hour change indicates a slight increase of 0.33%, it has not changed the larger trend.
On the other side, Cas Abbe's analysis of the Bitcoin liquidation heatmap indicates that downside liquidity has already been exhausted. This means that sellers have run out of short-term liquidity pools, which may cut down the possibility of another steep drop.

BTC Liquidation Map : Source : Coinglass
The majority of the liquidity is now concentrated above the current price, which creates an opportunity of a short squeeze. In case of the trigger, Bitcoin can approach the zone of $115,000-$116,000, where the most significant liquidity is located.
According to Glassnode data, however, long-term holders (LTHs) have already made more than 3.27 million BTC in profits this cycle. That number is close to the 3.93 million BTC high of the 2016-2017 bull market.
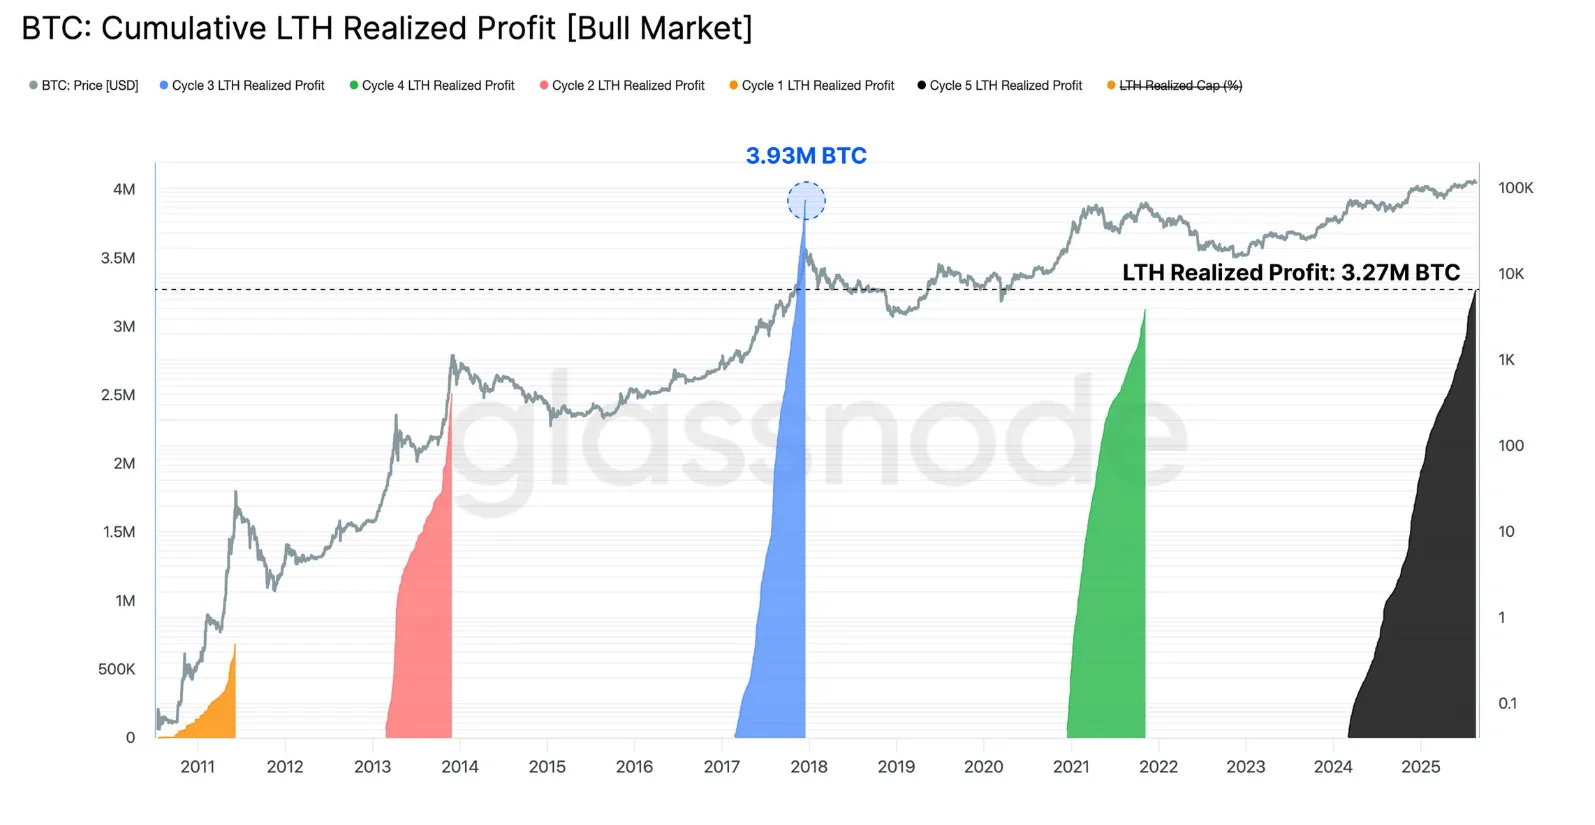
BTC Cumulative LTH Realized Profit (Bull Market) : Source : glassnode
Historically, such high levels of realized profits by experienced holders have tended to come before cycle tops. This pattern indicates that distribution is occurring and may restrict any large scale upside moves in the short term.
Owned by:-
DCG Tech FZCO, UAE
Delivery Partner:-
Gabbar MediaTech Pvt Ltd.
Copyright © 2026 Coin Gabbar. All Rights Reserved


