Bitcoin Price Prediction: Is BTC Heading for a Major Crash?

Bearish Signals: Why This Bitcoin Price Prediction Looks Weak
The latest Bitcoin Price Prediction has turned weak as BTC fell 1.85% in the last 24 hours to $68,668.19.
This drop comes as global markets shift into a risk-off mood, with rising U.S.-Iran tensions pushing traders away from risk assets.
This is not just a crypto-only move.
Bitcoin is showing a strong 84% correlation with the S&P 500, which means broader macro pressure is also weighing on price action.
Rate pressure, dollar strength, and weak market sentiment are all adding stress.
At the same time, the broader market cap slipped 1.83% to $2.36 trillion, showing that confidence has softened.
With volatility rising and risk appetite fading, traders are now watching one key question: can BTC hold support, or is Bitcoin setting up for a deeper pullback?
Bitcoin Faces More Pressure From ETF Outflows
The Bitcoin Price Prediction has come under pressure after fresh weakness appeared in the ETF market.
According to a BSCN update based on SoSoValue data, spot Bitcoin ETFs recorded $171 million in net outflows on March 26.
BlackRock’s IBIT alone saw nearly $41.92 million in outflows.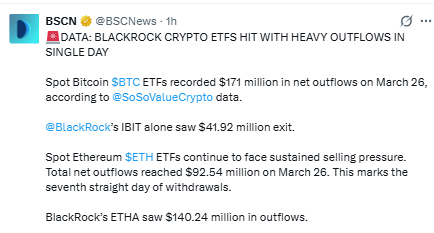
That is important because ETF flows often show how large investors are reacting during uncertain market conditions.
For BTC, this signals weaker short-term demand from institutions.
When money starts leaving spot ETFs, it can add pressure to price action, especially when broader market sentiment is already soft.
With macro fear still high, these ETF outflows have added one more bearish signal and may keep it under pressure in the near term.
Rising Wedge Puts Price at a Make-or-Break Zone
On the 4-hour chart, coin is still trading inside a rising wedge, a pattern that often points to weakening momentum and a possible bearish breakdown.
What makes this setup more important is that it has already bounced from the wedge’s lower trendline several times, and price is now back near the same support zone once again.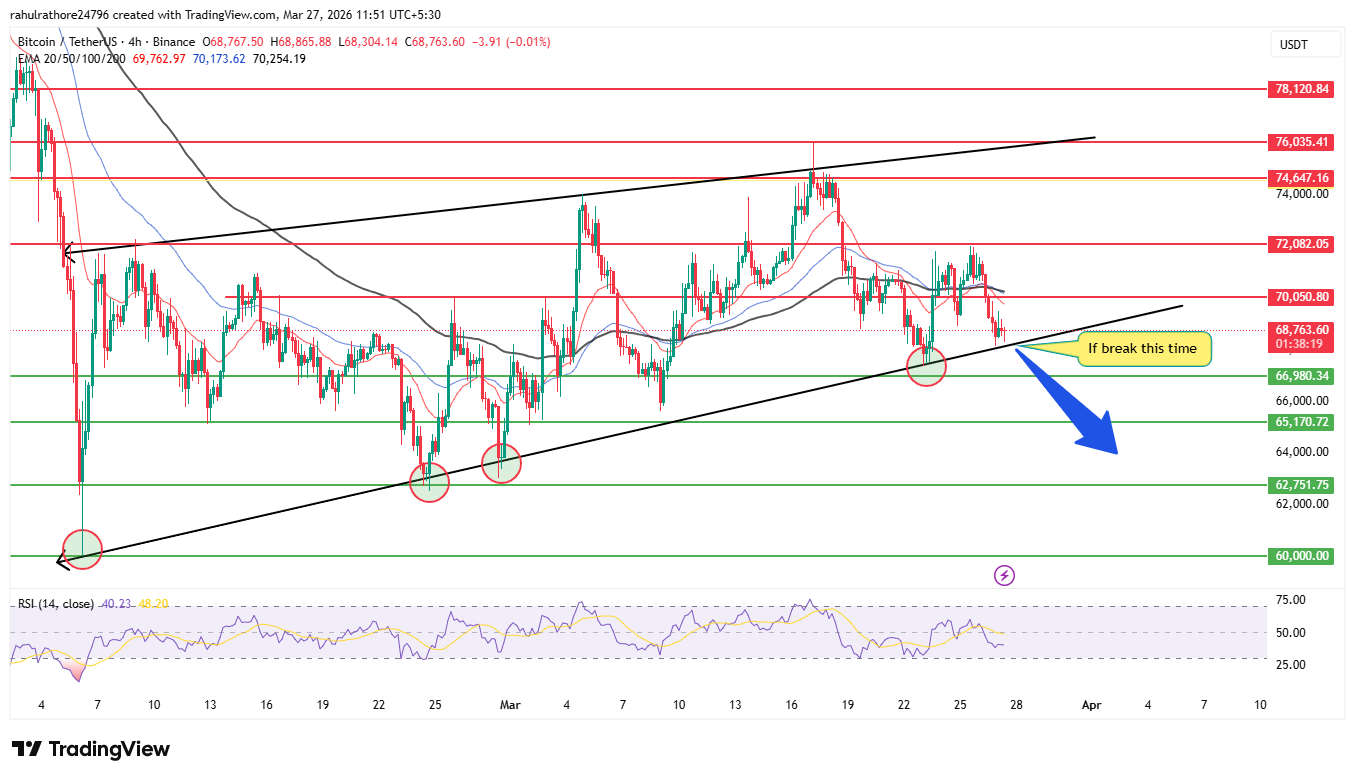
The structure looks more fragile because the price is trading below the 20, 50, and 100 EMA, which shows that short-term trend strength remains weak.
At the same time, the RSI is near 41, suggesting that price is under pressure but still has room to fall if sellers stay active.
If it breaks below the wedge support, the next downside levels to watch are:
$66,980
$65,170
$62,751
$60,000
If the price manages to rebound from this area, then the upside levels are:
$70,050
$72,082
$74,647
$76,035
For now, the chart is kept in a weak position.
Unless the coin reclaims nearby resistance, the risk of a downside move remains high.
Bear Flag Points to Deeper BTC Risk
A bearish view also came from Ted Pillows, who said on X that BTC has formed another bear flag on the daily chart.
According to his setup, a daily close below $66,000 could open the door to fresh downside pressure.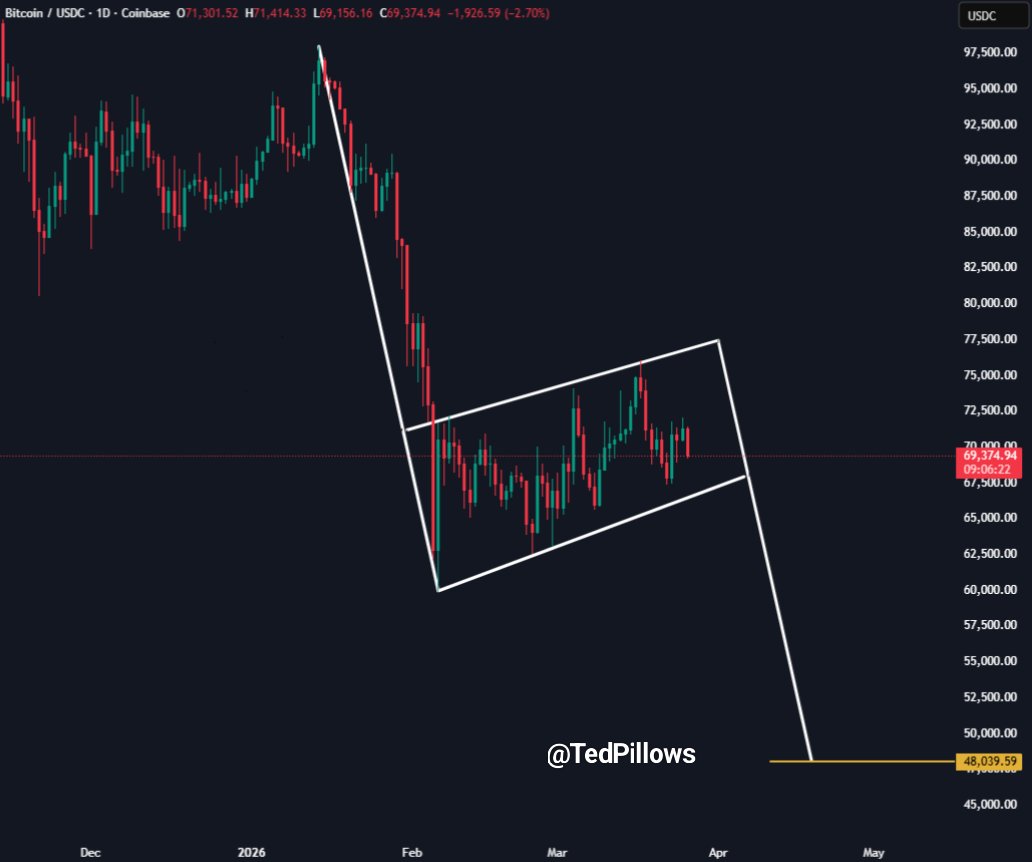
The chart shows Bitcoin moving inside a rising flag after a sharp drop, which is often seen as a continuation pattern in a weak trend.
If that breakdown happens, the image points to a possible downside target near $48,039.
This does not confirm a crash, but it does show that BTC could face a much deeper correction if key support fails.
Ali Charts Flags Deeper Dip Zones for BTC
A broader long-term view from Ali Charts shows where Bitcoin could find stronger interest if the current weakness turns into a bigger correction.
In an X post, Ali Martinez said BTC has often started new bull runs after falling below two key levels: the long-term holder realized price and the −0.2 standard deviation band.
On the chart, those zones sit near $48,387 and $36,657.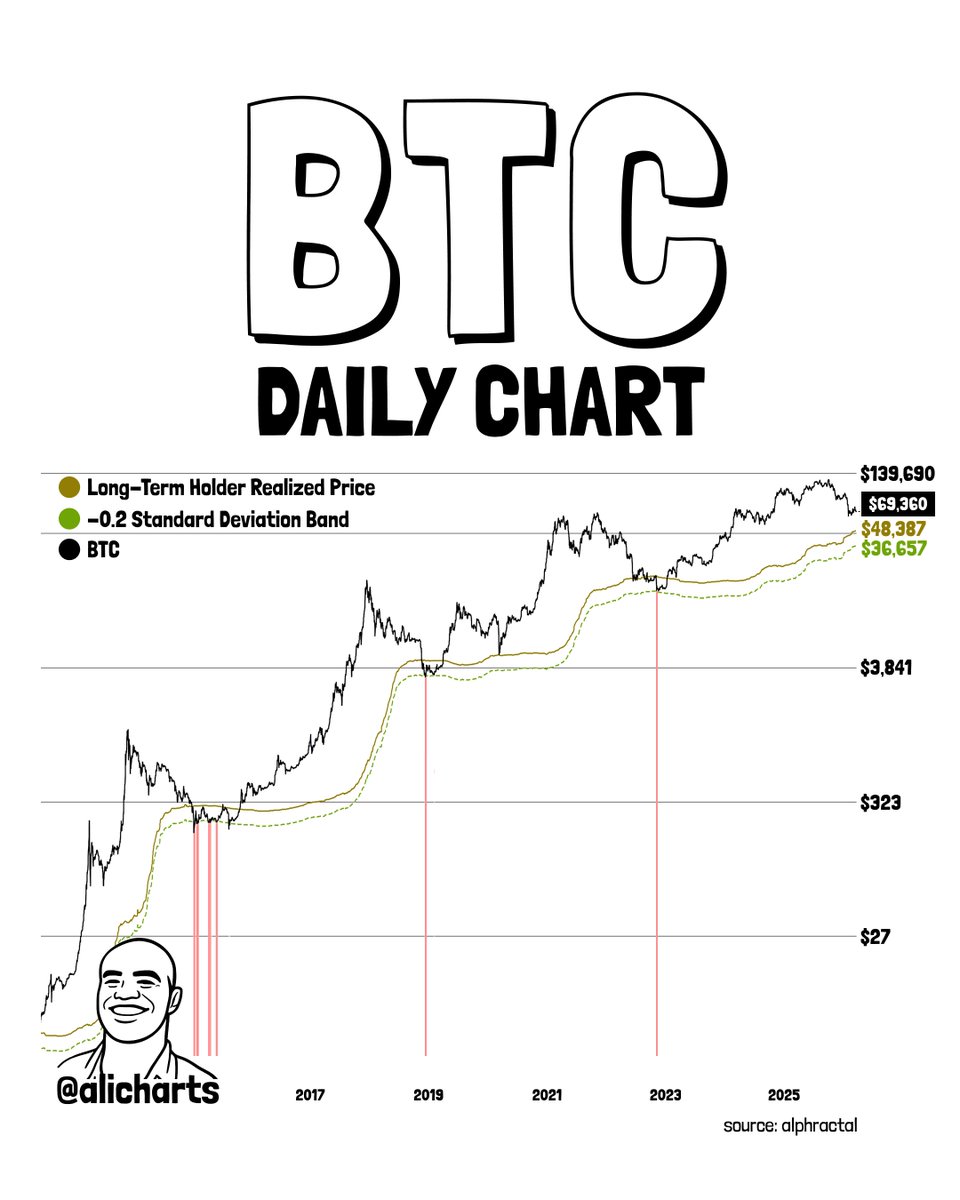
For Bitcoin, this does not mean the price is certain to drop there next.
But it does show where long-term buyers may start looking for dip-buying opportunities if selling pressure grows.
So while BTC remains weak in the short term, this chart highlights two deeper zones that could become important ahead of the next bull cycle.
Expert View:
The current Bitcoin Price Prediction stays cautious as BTC trades near a key support zone while bearish signals continue to build.
Weak ETF flows, soft macro sentiment, and pressure below the 20, 50, and 100 EMA show that buyers are still on the back foot.
If Bitcoin loses the $66,000–$66,980 area, the next downside move could stretch toward lower support levels.
For now, BTC needs a strong rebound above nearby resistance to ease the bearish pressure and improve short-term sentiment.
Disclaimer: Cryptocurrency markets are highly volatile. This price prediction is based on technical structure and current developments, not financial advice. Investors should conduct independent research and assess their risk tolerance before making any decisions.


