Bitcoin Weekly Price Prediction Signals Market Shift

Bitcoin Weekly Price Prediction Amid RSI and Market Shifts
Bitcoin traded near $92,728 on CoinMarketCap after a sudden reversal that cut earlier gains and triggered a 2–3% decline. The shift generated greater volatility and forced traders to re-examine market positioning. The sentiment changed in the short term with the buyers unable to maintain intraday momentum. The industry responded hesitantly with pressure on correlated assets on a wider scale.

Source:CoinMarketCap
This environment set the stage for a renewed examination of the bitcoin weekly price prediction and its developing structure. Analysts note that understanding why Bitcoin is down during sharp intraday reversals helps explain the landscape fading momentum and cautious sentiment.
Analytical Market Structure and Cycle Positioning
The current chart formation illustrates that the asset is accumulating within a wide consolidation band. The industry action represents the fading momentum around the $93,300-$95,000 resistance zone where the frequent rejection established a neutral-bearish tone. Most analysts this area since it constitutes the ceiling that governs the near term direction. Traders also reference btc price prediction models that highlight the importance of defending the mid-range zone to avoid deeper weakness.

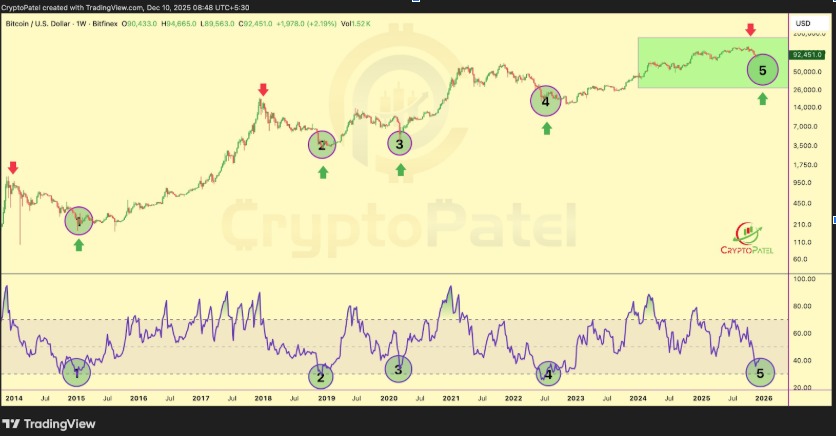
Source: TradingView
The weekly RSI has returned to a historically important demand area.In previous market phases, this area has generated significant turning points in the asset cycles. Every case corresponded to the weakened selling power and stable repositioning by long-term holders. Observers consider the latest RSI behavior meaningful because it reflects conditions similar to prior turning points. These signals influence long-term frameworks such as bitcoin price prediction 2030 and bitcoin price prediction 2026, which rely on multi-cycle structure analysis.
Support, Resistance, and Technical Signal Outlook
The support area between $82,000 and $87,500 remains a key region. Market participants keep an eye on this zone because it withstood repeated downside tests. Inability to hold it can divert attention towards the downward liquidity pools. The resistance is still close to $93,316 and $95,098, which limited recent price efforts. An upward movement above these thresholds would be a clean move that would cause short-term bias to recovery.
Source:TradingView
Momentum indicators present mixed readings. Daily RSI indicates a mid-range with weak strength. MACD continues to flatten, signaling hesitation rather than clear direction. Market analysts question whether this pattern indicates consolidation before expansion or a pause before another correction. These discussions appear frequently in crypto price prediction and bitcoin price crash analyses that weigh both structural strength and short-term fatigue.
Outlook and Weekly Projection
The asset may continue ranging inside the established corridor if buyers fail to clear $95,000. A move toward $87,000–$88,000 remains possible while the market resets. Any strong rebound from that zone could attract renewed accumulation. A confirmed breakout above $95K however, would shift the BTC weekly price prediction narrative toward a more constructive trend.