Dogecoin Price Prediction: As Price Breaks Out After Long Decline

Dogecoin Price Action Suggests Shift in Market Sentiment
The year has just begun, and the crypto market already looks a bit more active. On the second day itself, the overall market has gone up around 1.3%, crossing the $3 trillion mark again. Bitcoin, Ethereum, and XRP are all up by 1-3%; also, most of the meme coins are rallying, and then Dogecoin suddenly grabbed attention. The Doge jumped nearly 8.5% compared to the previous day and is currently trading around $0.1280. After a long period of decline, this move feels different, not too loud but hard to ignore. So now the big question is whether this is just a small bounce or the start of real recovery. After falling for weeks, can DOGE finally move towards higher levels?
Let's take a closer look at what the price actions are showing.
Short-Term Dogecoin Price Prediction After Recent Breakout Move
On the 4-hour chart, DOGE had been stuck in a downtrend for a long time. Price was following a falling trendline, and every attempt for upside was sold. Sellers stayed in control and DOGE kept making lower highs and lower lows. The 100 EMA was also acting like a strong barrier. Price touched it many times and got rejected.
Chart Source: TradingView
Things changed near $0.12000. Price dipped below this level for a short time and cleared out weak buyers. That dip did not hold for long. After the liquidity sweep, the price bounced back and broke above the down-trending line with better volume than before. More importantly, DOGE managed to stay above the trendline and also moved above the 100 EMA, which had not happened earlier. RSI supports this move; after being oversold, it has now moved up and is hovering around 63, showing improving momentum. Volume during the move also looks stronger compared to the previous range.
For a more bullish trend, if price holds above $0.12800, the price can move toward $0.13500 and then $0.14200 in the short term. If this move fails and the price drops back below $0.12000, the structure weakens and a move toward $0.11500 becomes possible.
Long-Term Dogecoin Price Outlook Based on Daily Chart
On the daily chart, price was trading inside a falling wedge for a long time. Price kept sliding lower and kept making lower lows. No strength was visible during that phase. Recently, DOGE finally broke out of this falling wedge, which changes the structure.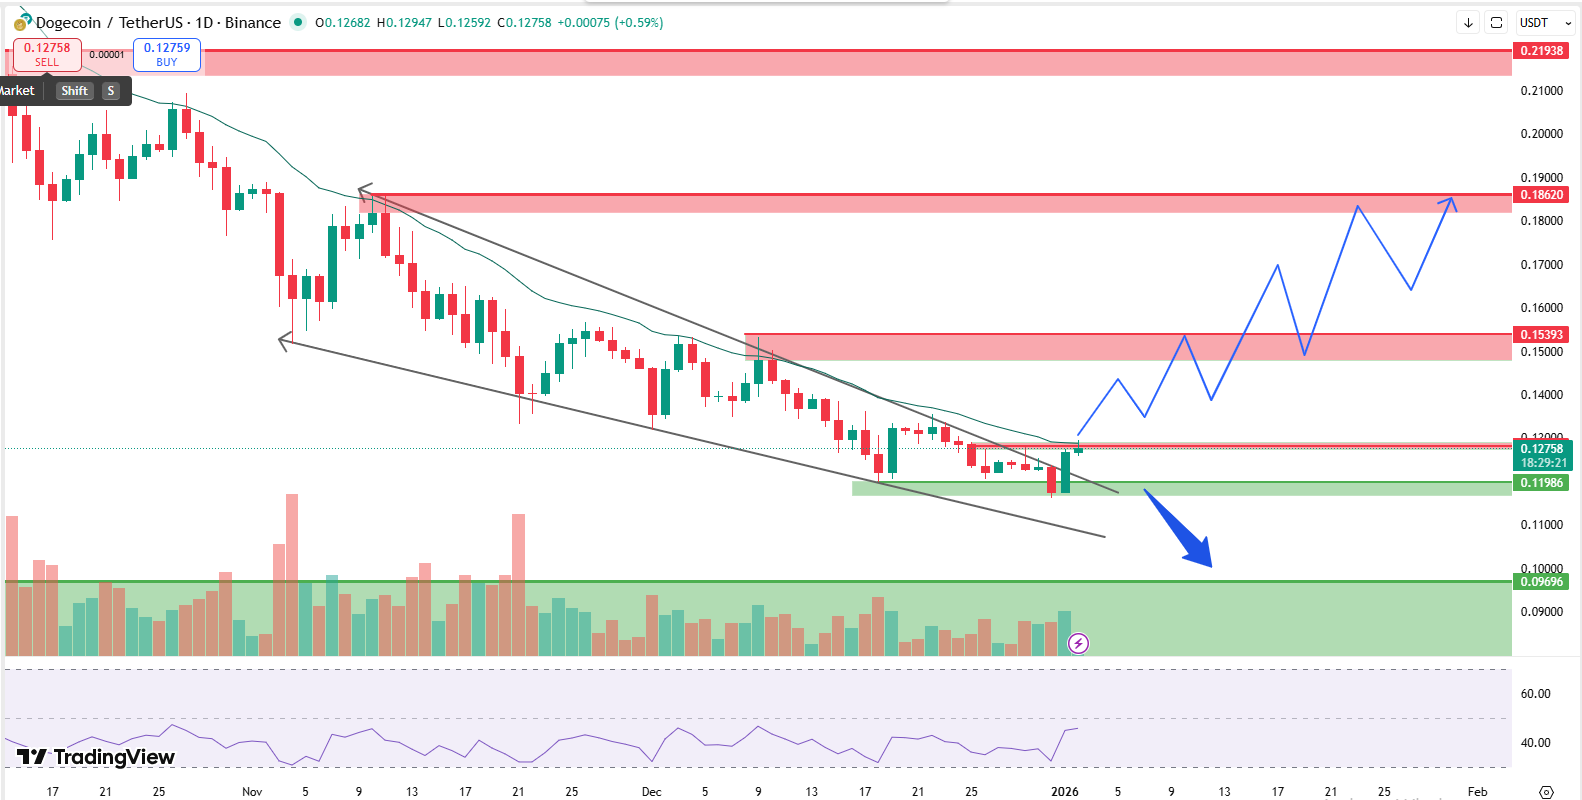
Chart Source: Tradingview
RSI is sitting near the neutral zone, not stretched on either side. Volume also looks slightly better than before, which supports the breakout, at least for now. The main issue right now is the 21 EMA. On the daily timeframe, this EMA has acted as strong resistance many times. Price is currently trading near this level; if Dogecoin manages to get a daily close above the 21 EMA, long-term upside reversal more realistic, and we might see the first resistance zone of $0.15000. followed by $0.18000 to $0.22000 later. If it fails and the price drops again, downside risk remains toward $0.10000 cannot be ruled out.
Expert View on Dogecoin Price Prediction
Dogecoin Price Prediction looks slightly better after the recent breakout, but the move is not fully confirmed yet. Price has improved from lower levels, though it is still near key resistance zones. Sustaining above important supports and moving averages will be critical. If momentum holds, higher levels can be tested slowly. If strength fades, quick pullbacks are still possible due to high volatility.
Disclaimer: This article is for informational purposes only and does not constitute financial advice. Crypto investments involve risk; always do your own research


