- News
- Price Prediction
- Press Release
- Crypto Airdrop ›
- Presale / ICO ›
- Events
- Listing
- Tools ›
- Casino ›
-


Ethereum is currently hovering around the $4,717 mark following a sharp surge of 10% in the last 24 hours. Analysts now highlight new bullish targets on the altcoin price, based on technical breakouts, cycle patterns, and increasing institutional activity.
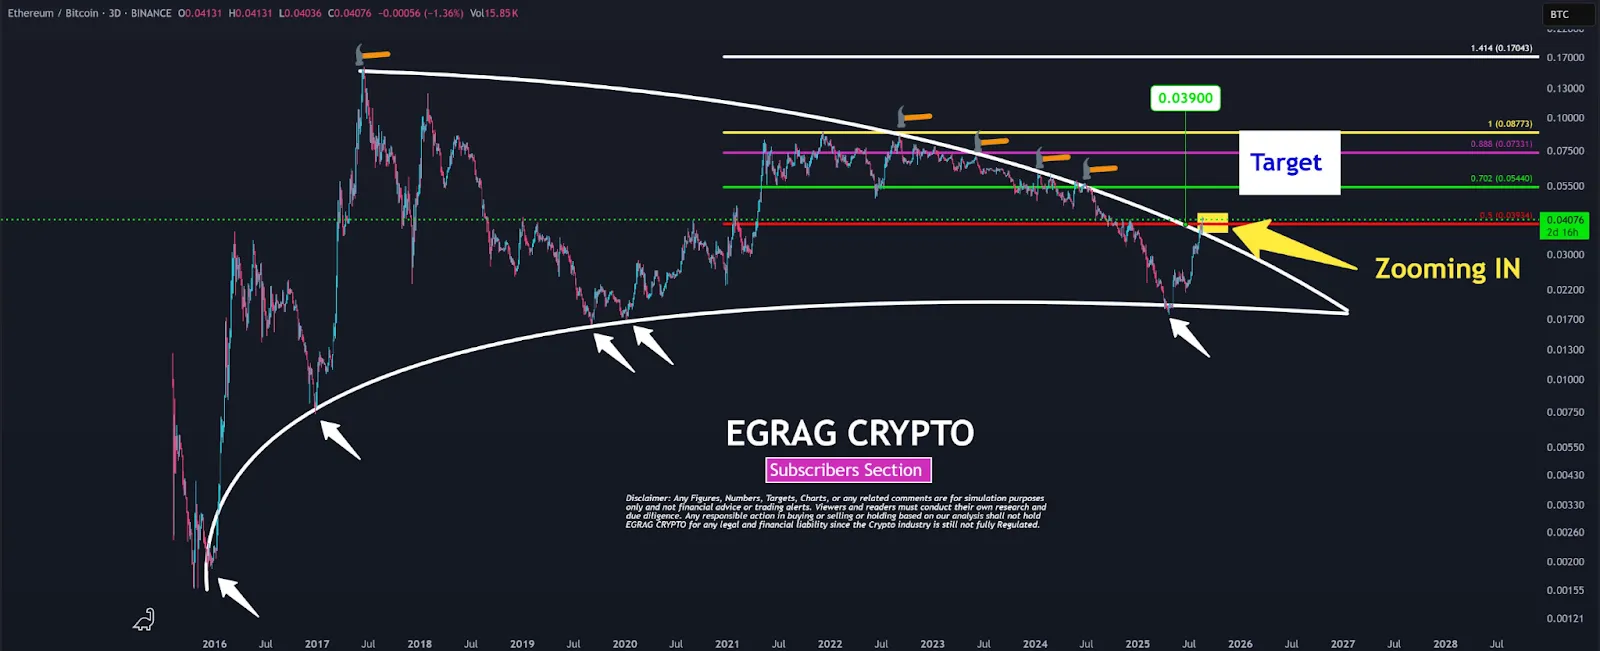
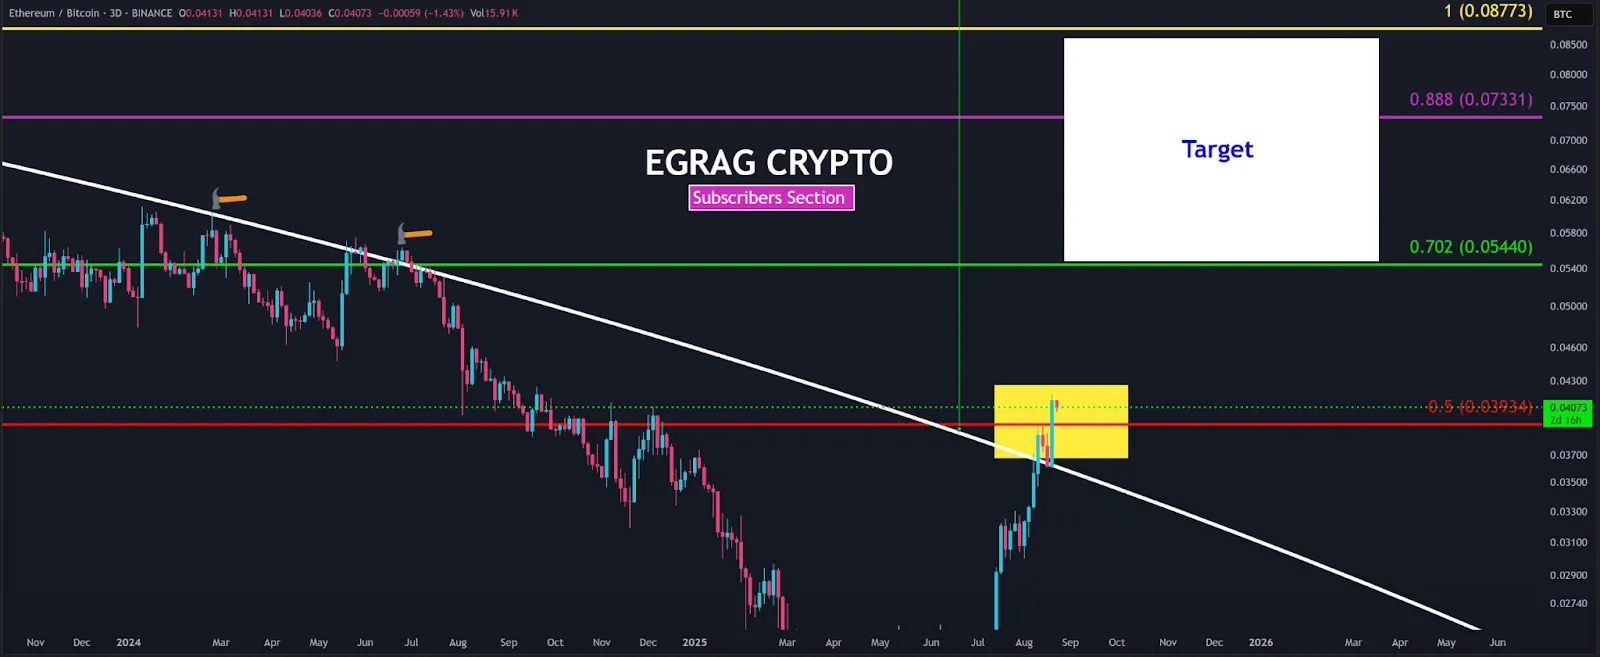
Analyst EGRAG CRYPTO affirmed that ETH/BTC has now successfully broken a multi-year descending resistance trendline. The breakout was also confirmed when the pair retested the area, successfully demonstrating strength in continuation.
BTC Ratio | Source : X
In terms of Fibonacci, 0.03934 is the support that the ratio must not break now. Staying above this level preserves the bullish run, whereas a failure could nullify the bullish run.
Price Forecast | Source : X
The short-term bullish objective is 0.05440, which coincides with Fib 0.702, which is a potential mid-cycle resistance area. EGRAG also expects higher levels at 0.07331 and 0.08773, with the latter expected to be a possible peak before correction.
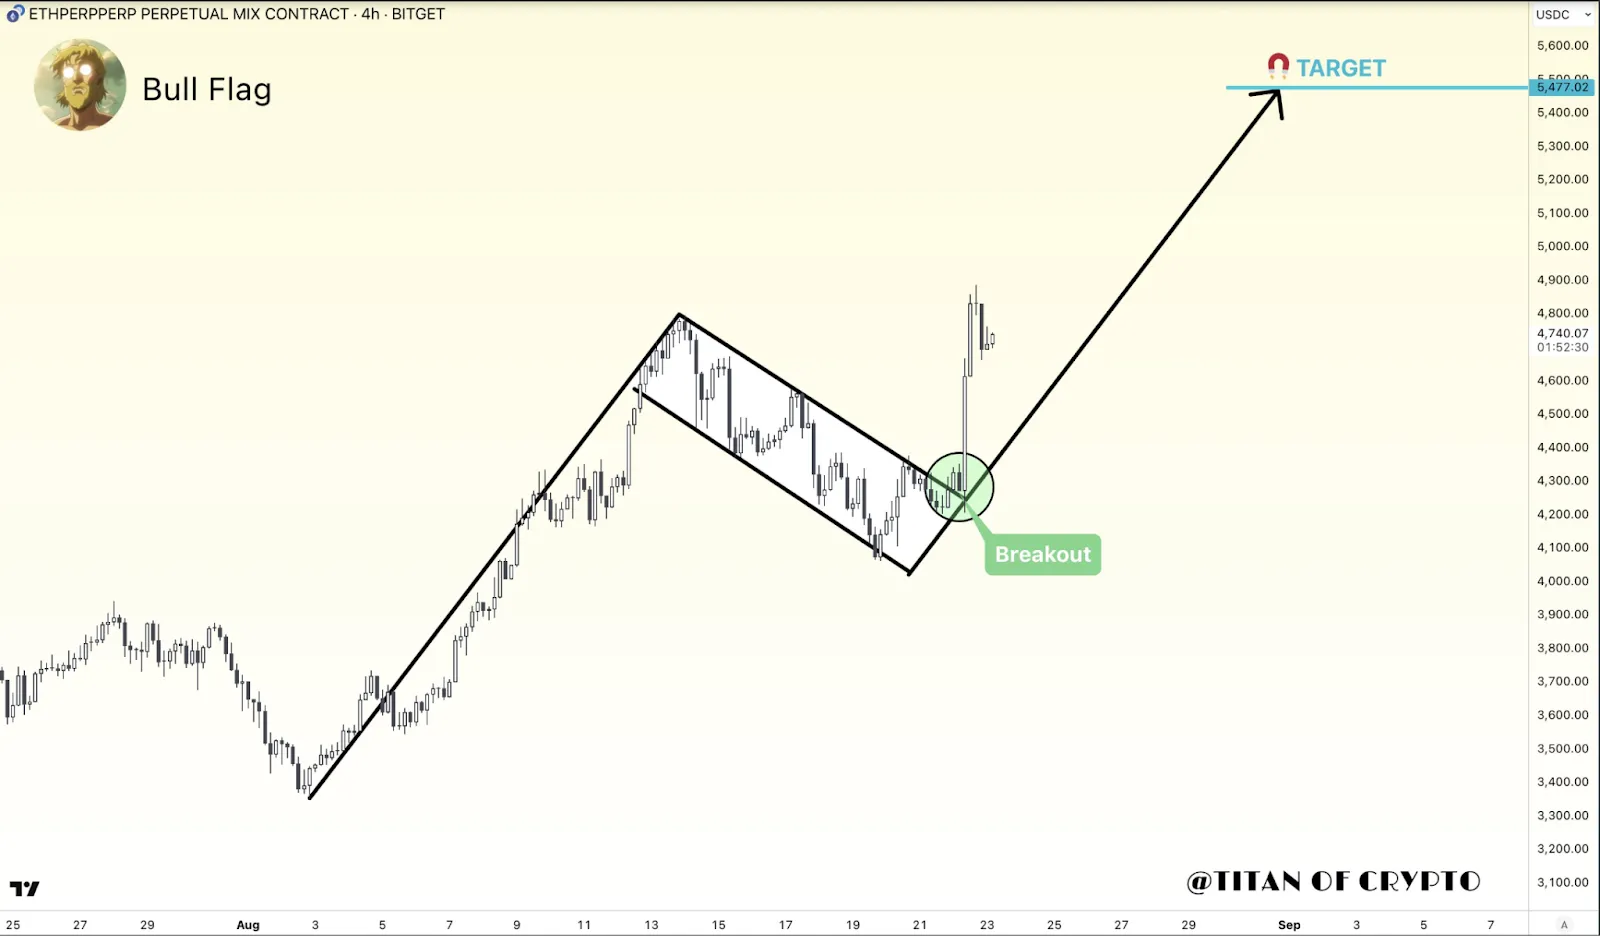
Analyst Titan Crypto marked a confirmed bull flag breakout on the 4-hour Ethereum chart. This extension trend indicates that the ETH price is resuming the uptrend after experiencing some consolidation. The breakout target, based on the measured move, is at $5,400.
Ethereum bull flag | Source : X
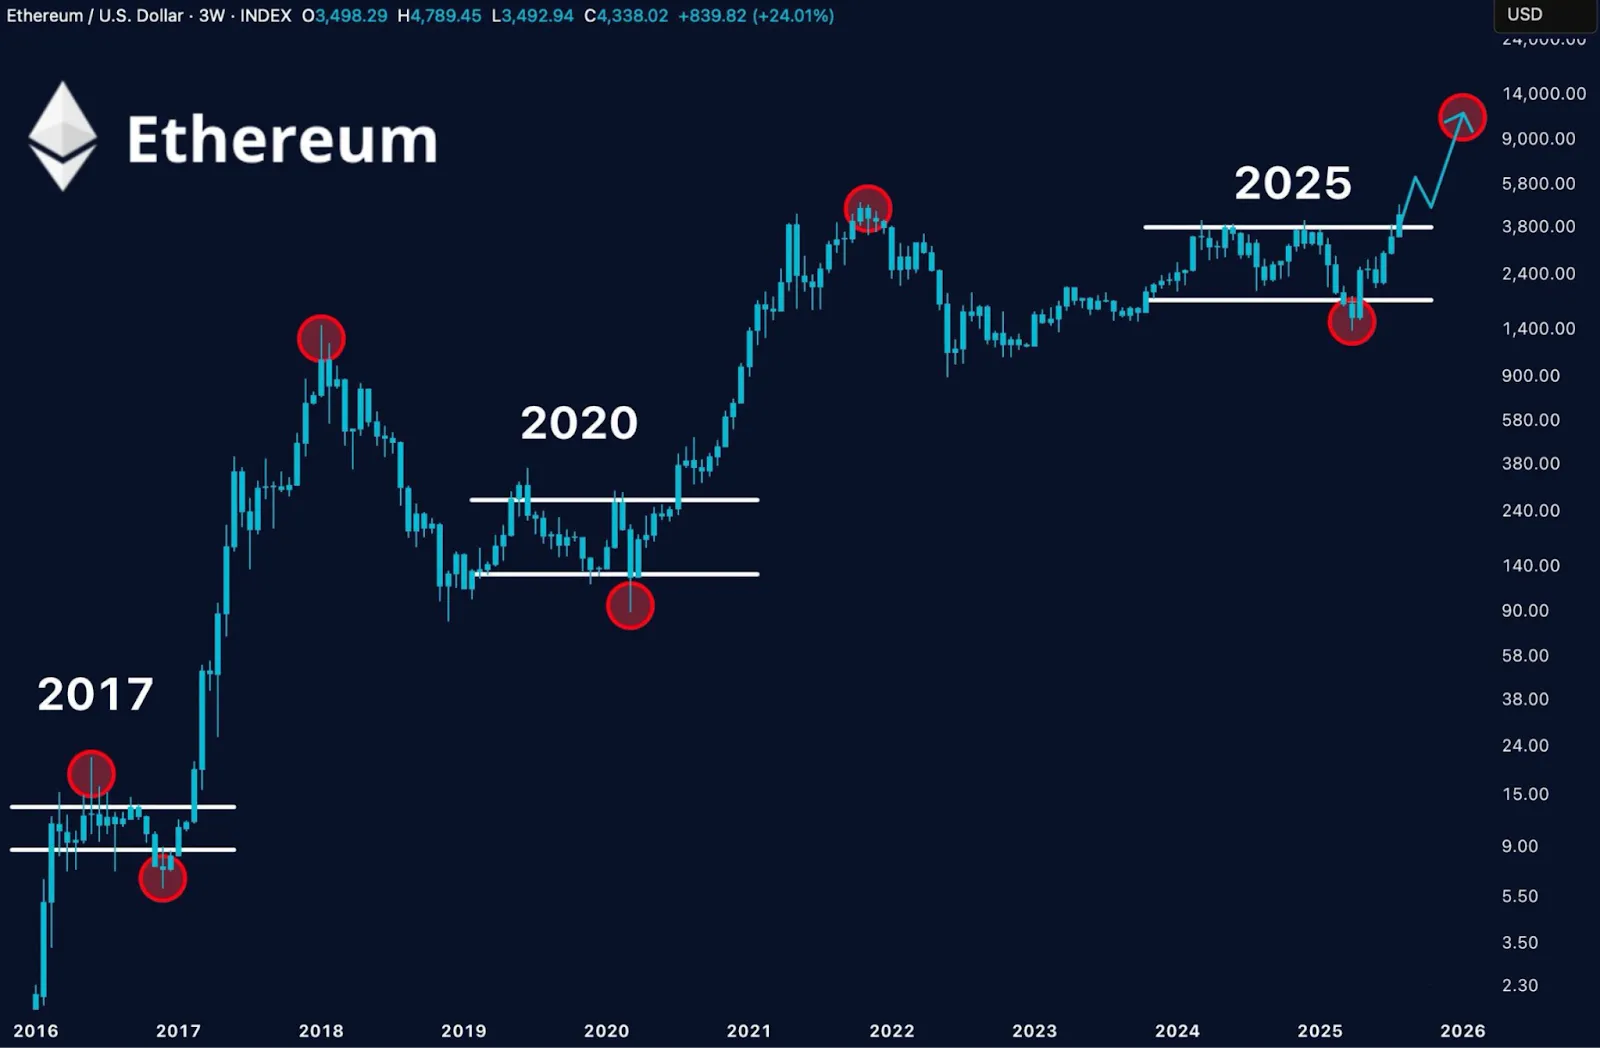
Crypto GEMs added a wider cycle view, which alludes to ETH price replaying its historic pattern. He points out that the prior accumulation levels in 2017 and 2020 were followed by strong rallies.
Source : X
The present cycle indicates Ethereum surging out of a long accumulation range of between $1,400 and $3,800. The trend might drive the top crypto to a price of between $10,000 and $14,000 in the long-term.
However, analyst Michaël van de Poppe noted that the crypto might not increase linearly and pointed out retracement areas at the levels of $4,400 and $4,200. He regards such pullbacks as healthy continuation, since it is a resetting of momentum before further rises.
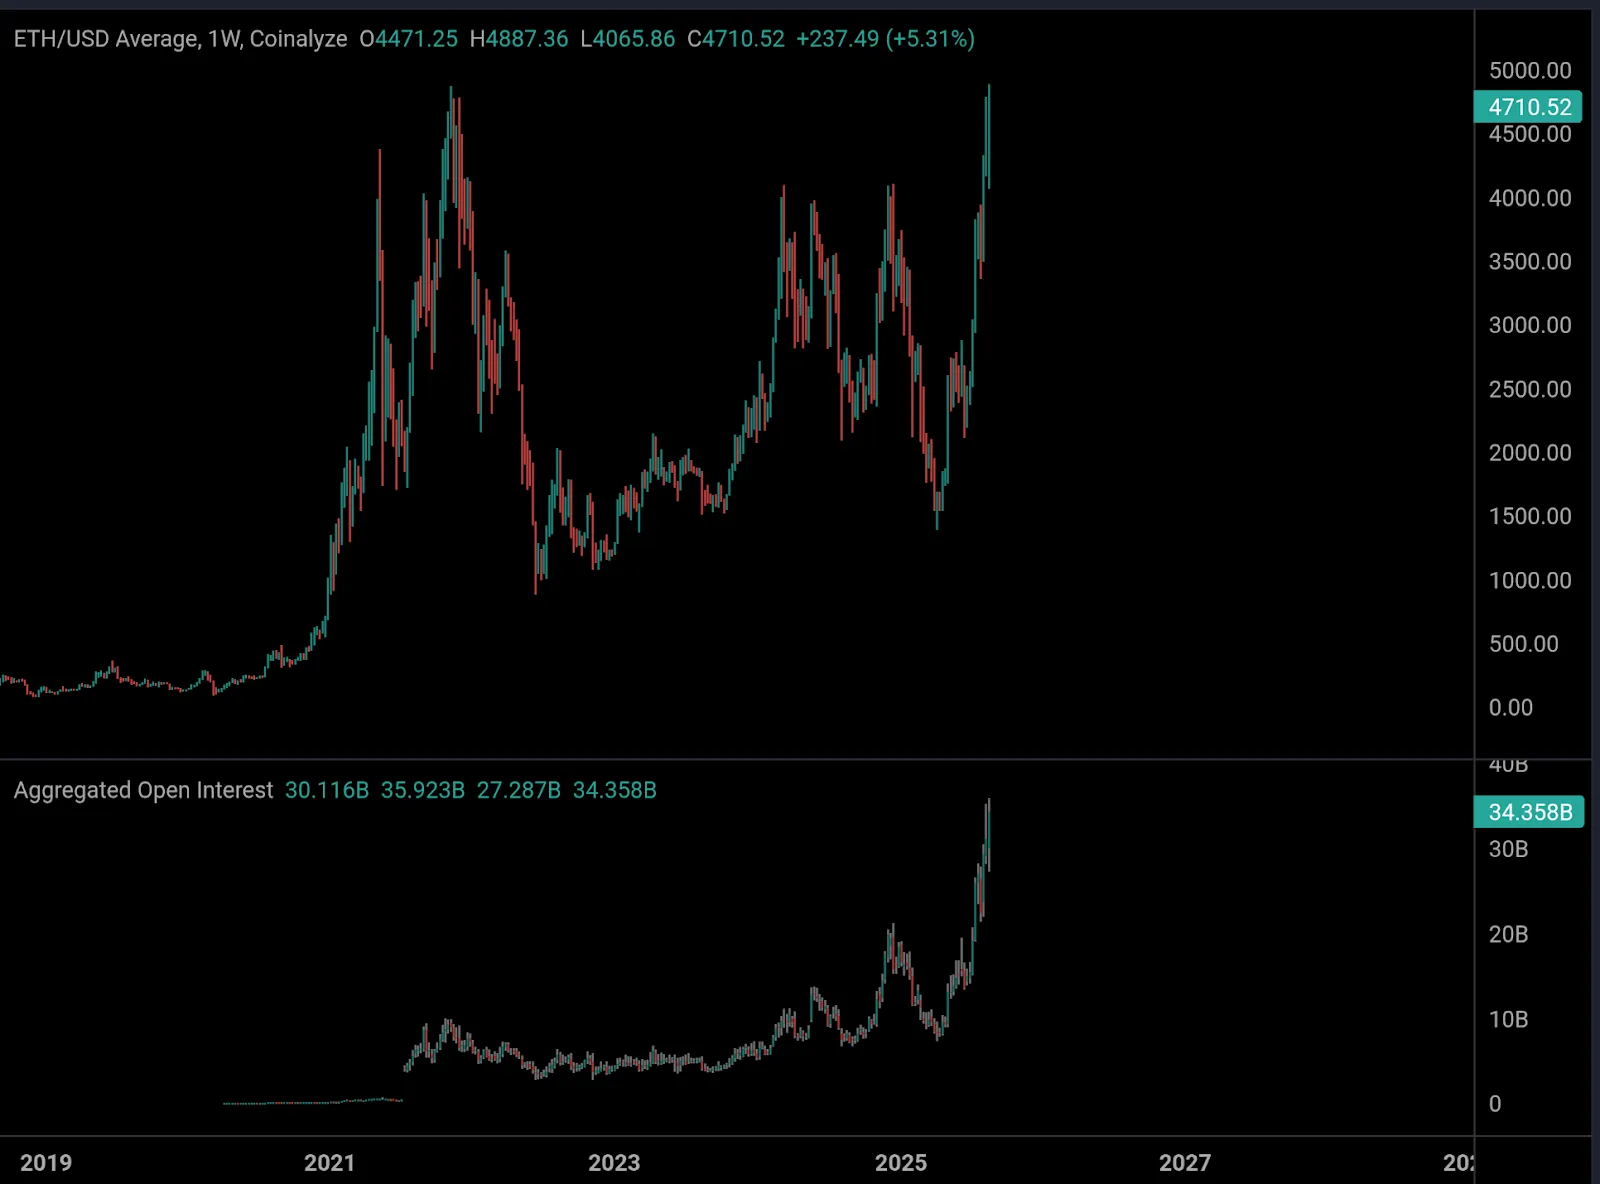
Ethereum has an open interest of more than $34.5 billion, setting a new record, according to data provided by analyst Maartunn. The increase exceeds past cycle peaks and is an indication of traders being aggressive in anticipating further increases.
Source : X
The Moon Show also indicated open interest of more than $28 billion earlier in the month, further indicating the sharp rise in leveraged exposure. Although the trend is an indication of a high bullish sentiment, it also increases the chances of volatility due to cascading liquidations.
Meanwhile, institutional flows are still affecting altcoin markets. Glassnode statistics showed that U.S. spot Ethereum ETFs experienced an outflow of 111,000 ETH, which increased recent market volatility.
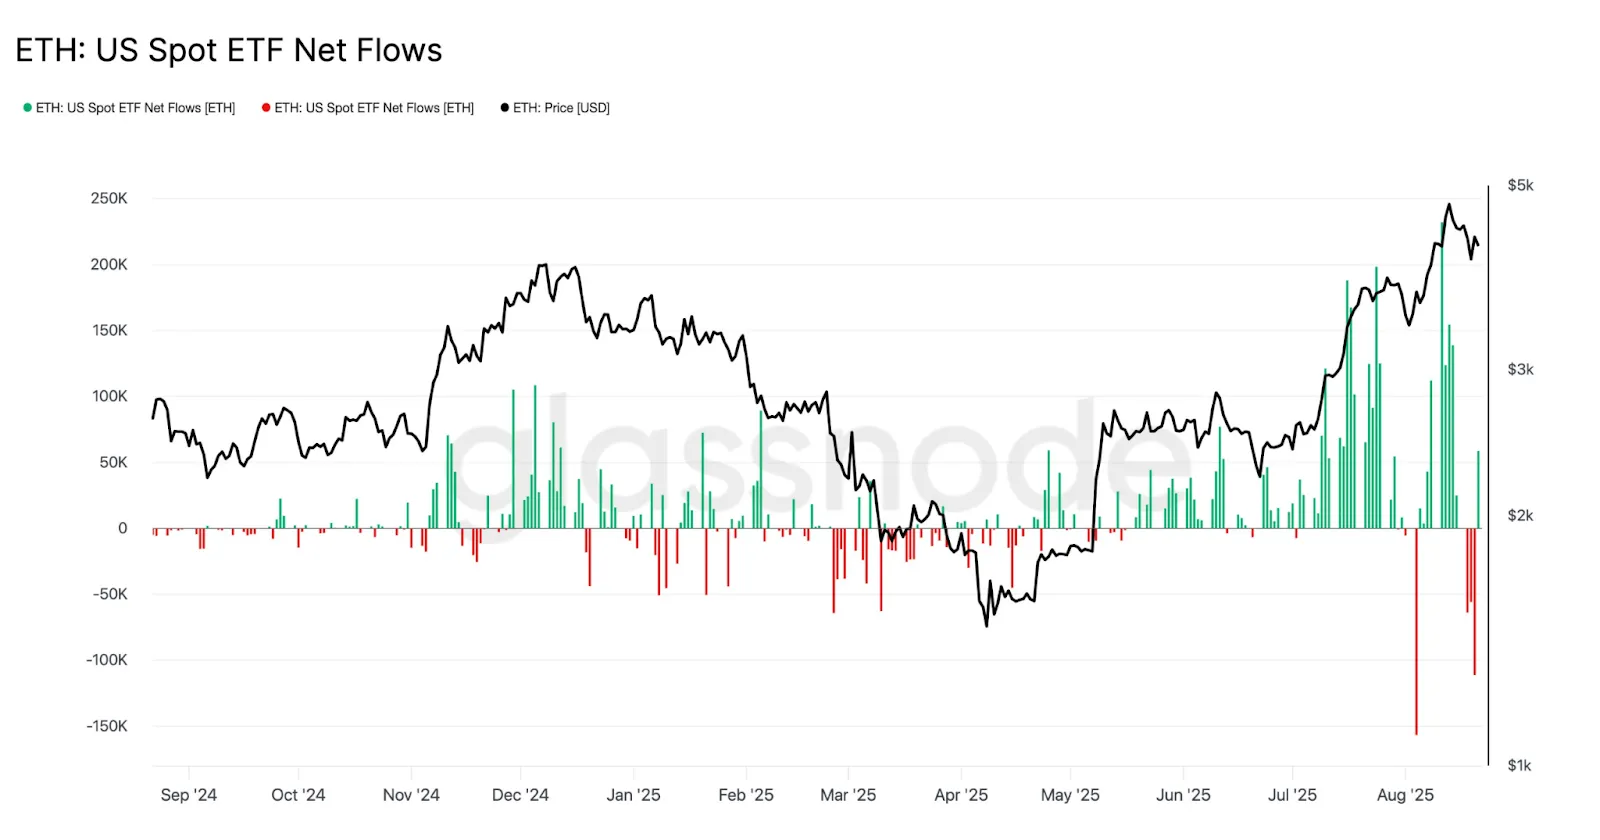
US spot ETF net flow | Source : glassnode
Nevertheless, confidence in the cryptocurrency has been maintained, as U.S. President Donald Trump recently purchased $5 million worth of Ethereum. His portfolio is currently 96% ETH, as institutions and the political environment increasingly take an interest in the asset.
Owned by:-
DCG Tech FZCO, UAE
Delivery Partner:-
Gabbar MediaTech Pvt Ltd.
Copyright © 2026 Coin Gabbar. All Rights Reserved


