- News
- Price Prediction
- Press Release
- Crypto Airdrop ›
- Presale / ICO ›
- Events
- Listing
- Tools ›
- Casino ›
-


Ethereum (ETH) is currently priced at $4,299.30, reflecting a modest 0.04% increase in the past 24 hours. However, the cryptocurrency has faced a significant 7.47% decline in value over the last week.
Focus is now on periods of corrections with renewed interest among investors as the capital movement has been spiked into the U.S. spot Ether ETFs.
Notably, on Thursday, net inflows of $287.6 million grabbed the attention of U.S. spot Ether ETFs accompanied by a possible change in investor attitude. This came after several days of outflows, which had seen more than $924 million exit these funds since August 15.

Source: SosoValue
Spot Ether ETFs currently hold a stack of 6.42M ETH, valued at an estimated $27.66 billion. The funds recorded net inflows of 66,350 ETH, accounting for 5.31% of Ethereum's circulating supply.
These inflows revealed a shift in market dynamics following one of the most prominent outflows on Tuesday of $429M. It was second in line for this month. BlackRock's iShares Ethereum Trust (ETHA) spearheaded this inflow, adding $233.5 million of that total, with Fidelity's ETH Fund (FETH) being the runner-up, adding $28.5 million. The remainder of the ETF offerings saw more modest inflows of about $6 million a piece.
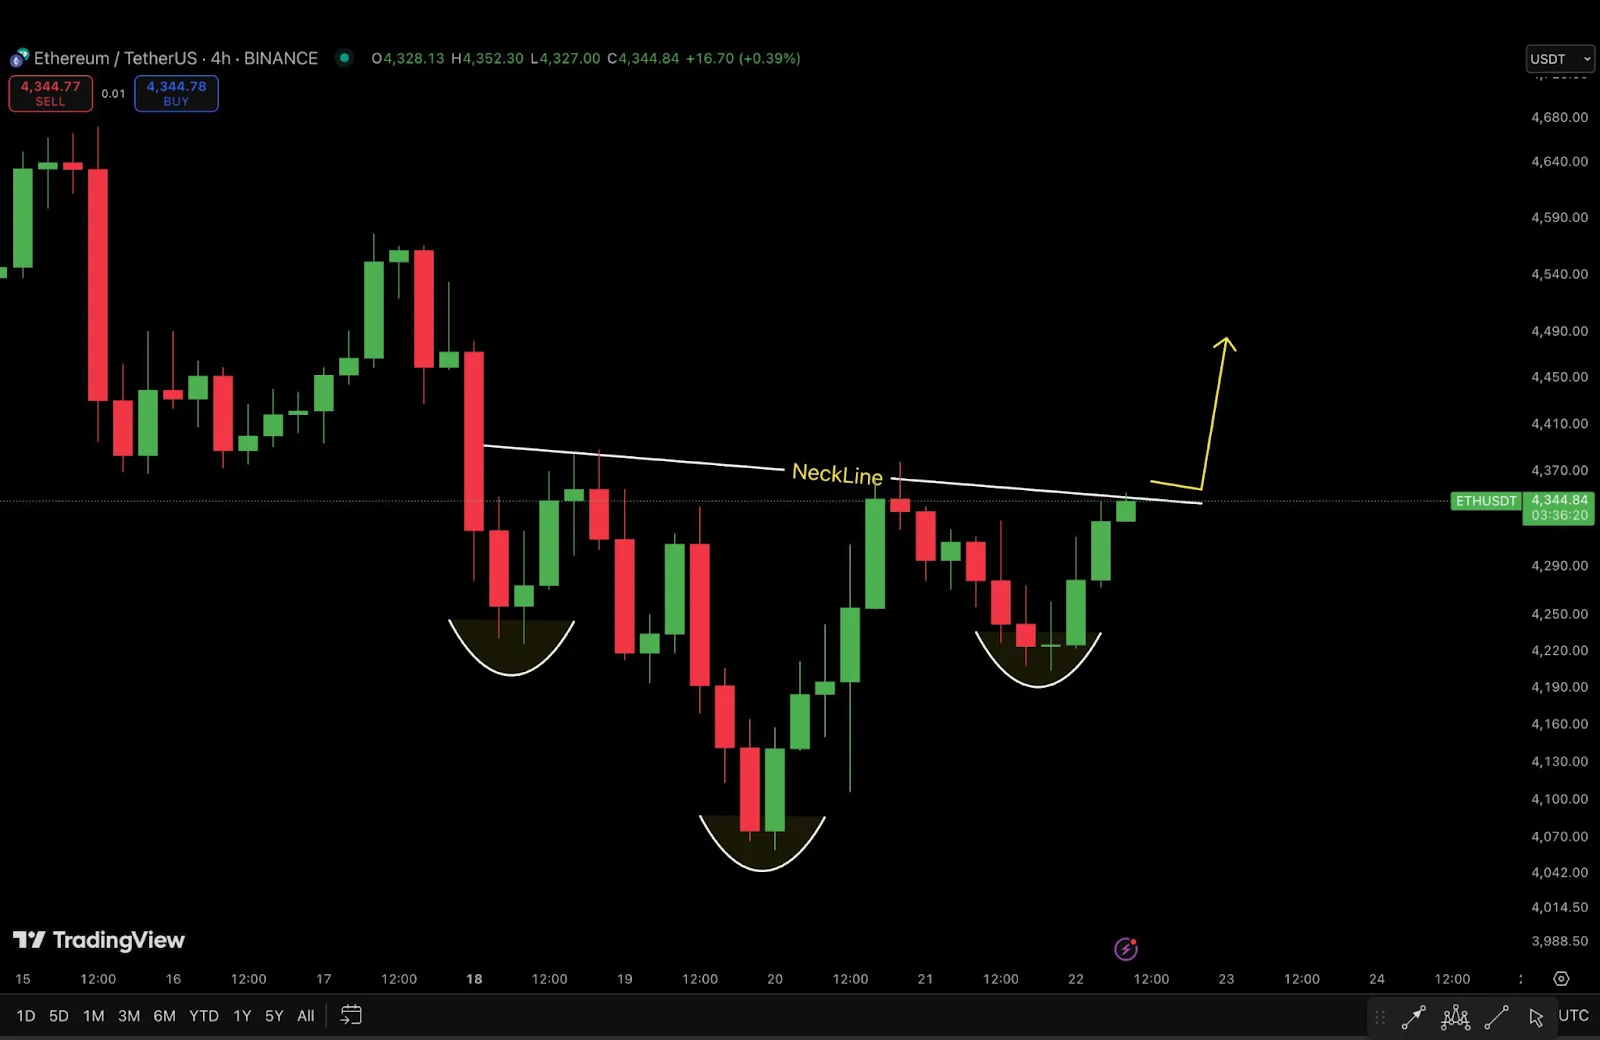
Meanwhile, the technical analysts are paying attention to Ethereum's prices from Binance on the 4-hour timeframe, where an inverse head and shoulders pattern is forming. The pattern shared by Ash Crypto is considered a reversal, with a probable shift from downtrend to uptrend. Three parts distinguish this pattern: the left shoulder, the head, and the right shoulder.
Source: X
The left shoulder was formed when the price of Ether dropped to $4,220 on August 18. The following recovery then saw the setting of the head, with prices falling to $4,070 on August 20.
Following that dip, Ethereum started to rise again, forming the right shoulder around August 21. This right shoulder tested the $4,210-$4,220 range, but the low was notably higher than the previous one, indicating a potential bullish divergence.
The critical neckline of the pattern, located at $4,350, acts as a key resistance level. Should Ethereum break above this level, analysts expect the completion of the inverse head and shoulders pattern. If confirmed, the breakout could signal the start of a price rally, with potential targets in the $4,450-$4,500 range.
Owned by:-
DCG Tech FZCO, UAE
Delivery Partner:-
Gabbar MediaTech Pvt Ltd.
Copyright © 2026 Coin Gabbar. All Rights Reserved


