Ethereum Price Prediction: Will ETH Lose the $2000 Support?

Ethereum Price Prediction: Is a Major Dip Coming in ETH?
Crypto market right now is not silent—it feels tense, almost like something is building beneath the surface.
The total market cap is holding near $2.35T, but even a modest 1.59% decline has started to shake confidence among traders.
Ethereum Price Prediction is suddenly back in focus, not because of excitement, but because uncertainty is creeping in.
ETH has slipped toward the $2,050 level after a sharp intraday drop, and the shift in sentiment is becoming hard to ignore.
Bitcoin is still trying to defend the $68,000 zone, but Ethereum is showing relative weakness.
That divergence often signals a broader risk-off mood in the crypto market.
At the same time, liquidity conditions are gradually tightening, buyers are becoming more selective, and sellers are beginning to gain short-term control.
This does not look like panic yet, but stability is clearly weakening.
So the real question is no longer just about a minor dip.
Is this a temporary pullback, or is Ethereum slowly moving toward a deeper breakdown below the $2000 support zone?
Ethereum Price Prediction: Whale Dump Sparks Fresh Fear
As per the tweet data shared by BSCN News, a long-term Ethereum holder has offloaded a massive 15,002 ETH in a single transaction, worth nearly $30.9 million.
According to on-chain insights highlighted in the same update, this wallet had accumulated ETH almost a decade ago, when its total value was just around $2.2 million.
Today, that position has grown beyond $350 million—making this sell-off not just large, but psychologically important.
This is not just another transaction.
When an early holder, often seen as “smart money,” decides to exit a chunk at current levels, it quietly signals a shift in confidence. It suggests that even long-term participants are not fully comfortable holding through this phase.
And in a market already dealing with weak momentum, this kind of move adds more pressure than the numbers alone suggest.
Whale Signals Add to Uncertainty
As per data shared by Crypto Rover, large Ethereum whale wallets have just moved back near breakeven, with unrealized profits turning slightly positive.
On the surface, this looks like a recovery signal.
But in a weak market, this phase often turns into an exit opportunity rather than fresh accumulation.
That is where the risk builds.
Because when whales use strength to reduce positions instead of adding more, the market usually faces additional downside pressure.
ETH Structure Looks Weak: Breakdown Risk Below $2040
As per the chart shared by Ted Pillows, Ethereum is forming a classic head and shoulders pattern—a structure that often signals trend exhaustion.
The left shoulder, head, and a weaker right shoulder are already visible, with price now compressing near a key support zone.
That level sits around $2,040.
This zone has held multiple times, but each bounce is getting weaker. Buyers are still present, but conviction is fading.
And that is where risk builds.
If ETH loses this level, the move is unlikely to stay controlled, as selling pressure could accelerate quickly.
ETH Daily Chart Signals Weak Trend as Key Averages Break
On the daily timeframe, Ethereum is showing clear signs of weakness as price has slipped below both the rising trendline and key moving averages.
First, the trendline support broke, followed by price slipping below key moving averages, showing a gradual loss of strength.
Then the price started trading below the moving averages, and now it is struggling to reclaim strength.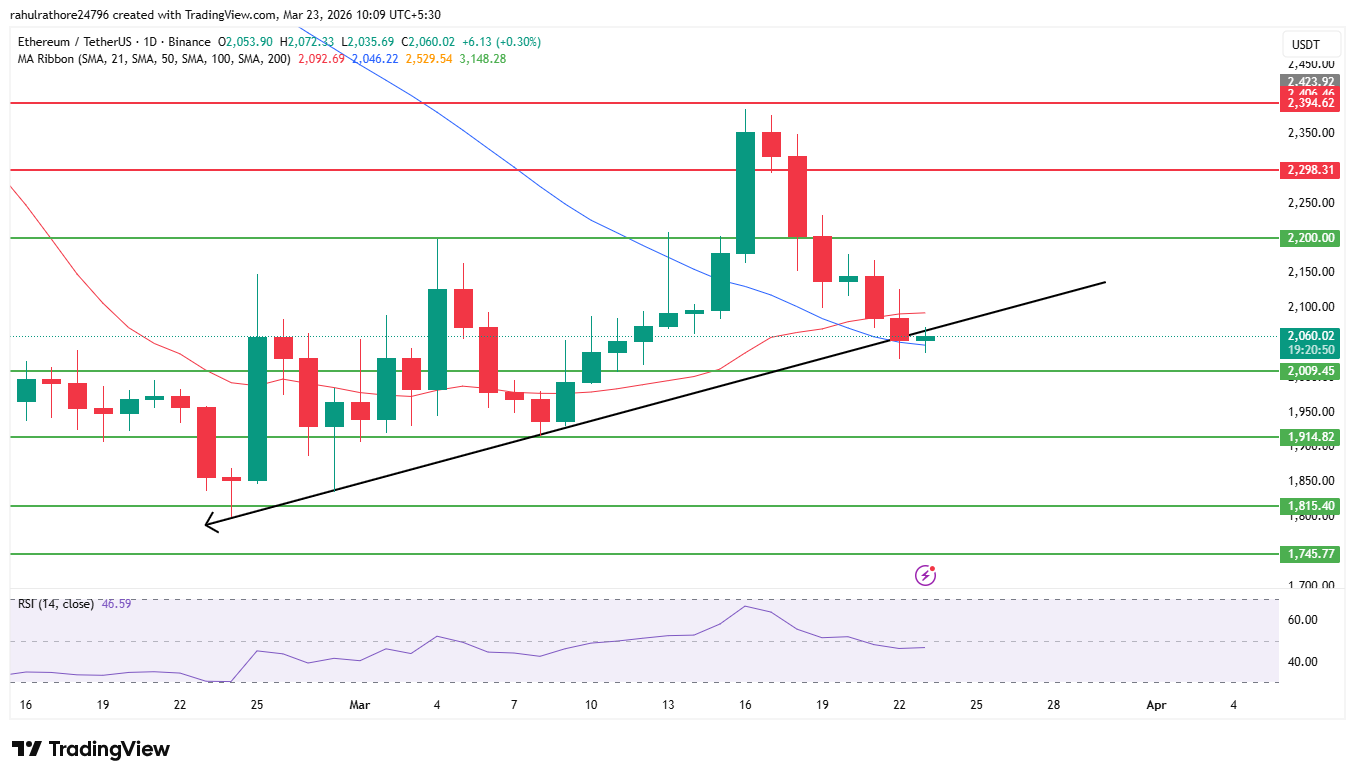
At the moment, ETH is trading around the 50 SMA near $2060, while the 20 SMA has crossed below the 50 SMA, forming a bearish crossover.
This setup usually reflects weakening momentum in the short term.
RSI is hovering near 45, which shows that the market is not deeply oversold yet—meaning there is still room for further downside before any strong bounce.
Key Levels to Watch
Immediate Support: $2040-$2060 (50 SMA zone)
Next Major Support: $2000
Lower Support Zones: $1914 and $1800 – $1700
If the current SMA support breaks, ETH could quickly test the $2000 level. A loss of that zone may open further downside toward $1914, and in extended selling pressure, even the $1800–$1700 range.
Resistance Levels
Short-Term Resistance: $2200
Higher Resistance: $2298 – $2394 zone
Short-term pullbacks are possible, but unless ETH reclaims $2200 with strength, these moves may remain temporary and face selling pressure again.
Weekly Structure Holds, But Breakdown Risk Still Exists
As per the analysis shared by Ali Martinez (Ali Charts), Ethereum is still trading within a long-term ascending triangle on the weekly timeframe.
The recent drop toward the $1800 level acted as a key reaction zone, aligning with the rising trendline support of this broader structure.
This makes $1800 an important level.
A bounce from this zone is still possible, especially if buyers step in with strength. But the overall structure is now under pressure after multiple lower highs on lower timeframes.
That changes the context.
Because if this trendline support and the $1800 zone fail to hold, the structure will break—and that could trigger a much deeper move on the downside.
Expert View
Market analysts suggest that the current Ethereum Price Prediction is leaning bearish as selling pressure continues to build across key levels.
Unless strong buying returns soon, ETH may struggle to hold support and could face further downside in the near term. The next move will likely be decided at support, not resistance.
Disclaimer: Cryptocurrency markets are highly volatile. This price prediction is based on technical structure and current developments and does not constitute financial advice. Investors should conduct independent research and assess risk tolerance before making decisions.


