Ethereum Price Prediction 2027: New ATH or Correction?


Ethereum Price Prediction 2027: Bullish or Bearish?
Ethereum Price Prediction: Eth is sitting at $1,581 right now, down 68% from its all-time high of $4,951 set in August 2025. On the surface, that looks rough. But the weekly chart is building something that experienced traders recognize, and it looks a lot more interesting than the price tag suggests.
Where Ethereum Stands Today June 27, 2026
| Metric | Value |
| Current Price | $1,581.04 |
| 24h Change | +0.97% |
| Market Cap | $190.8 Billion |
| 24h Volume | $11.13 Billion |
| Circulating Supply | 120.68 Million ETH |
| ETH ATH | $4,957.67 August 18, 2025 |
| Down from ATH | -68% |
Being down 68% from ATH sounds bad. But zoom out. ETH was in a similar position in mid-2023 before it ran to new highs. The structure forming right now on the weekly chart is the same type of setup that preceded that move.
What's the Analyst View on $ETH
As Per Cyclop crypto analyst , he is Buying ETH heavily at $1,070–$1,370
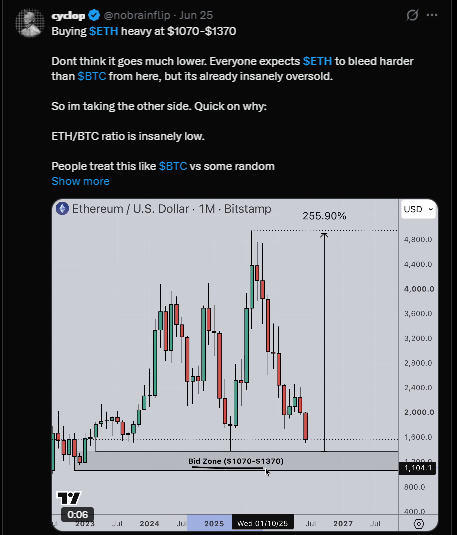
"Buying $ETH heavy at $1,070–$1,370. Don't think it goes much lower. Everyone expects $ETH to bleed harder than $BTC from here, but it's already insanely oversold. ETH has underperformed Bitcoin badly this cycle, and that ratio is sitting at historically low levels. When something gets this oversold relative to its pair, the mean reversion when it comes tends to be fast and violent. This analyst is positioning in the $1,070 to $1,370 zone ahead of that move.
As Per Ryker on X, ETH can go to $1,260 Before $10,000

As per Ryker on X, $ETH will hit $1,260 before staging a strong pump to $10,000. In the previous cycle, he bought ETH at $190 and sold at $4,000, making millions in profit."
RYKER's track record makes this worth noting. The $1,260 flush call actually fits the weekly chart perfectly: one more shakeout below current support to clear weak hands, and then . Whether $10,000 happens in this cycle is a stretch, but the direction of the trade is exactly what the chart is building toward.
Ethereum Technical Analysis 2027 The Weekly Chart Setup
After ETH peaked at $4,957.67 in August 2025, the weekly chart printed a textbook breakdown Break of structure to the downside, lower highs, and lower lows. Every bounce was sold. Bears were fully in control.
But something is changing now.
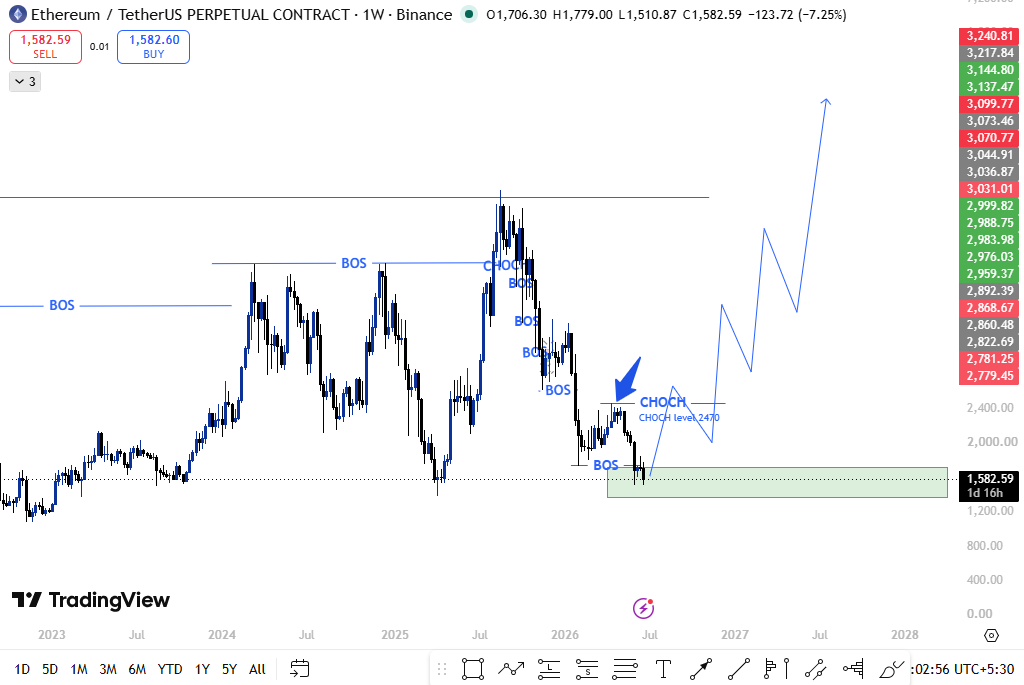
The chart is marking a change of character at $2,470. This is the level where the market structure officially flips. A weekly close above $2,470 could indicate weakening selling pressure and a possible shift in market structure.
It doesn't happen overnight, but once it does, the move that follows tends to be aggressive.
Here's the full sequence the chart is projecting:
-
$ETH holds the weekly demand zone at $1,510–$1,582, where it sits right now
-
Price pushes up and breaks the CHOCH level at $2,470 on a weekly close
-
After CHOCH confirms, a pullback toward $2,000 happens; this is healthy and expected
-
$2,000 holds as new support; this is the confirmation that structure has flipped
-
From there, the path to $3,000, $4,000, $5,000, and eventually $6,000–$8,000 opens up through 2027
Ethereum Price Prediction 2027: Key Support Levels
| Support Level | Significance |
| $1,510–$1,582 KEY ZONE | The weekly demand zone must hold for bullish setup to stay valid |
| $1,260–$1,370 | Analyst bid zone: final accumulation area before major reversal |
| $1,070–$1,200 | Deep support worst-case flush, RYKER's target before $10K call |
The $1,510 to $1,582 zone is where ETH is sitting right now. This level needs to hold. A weekly close below $1,510 opens the door toward the $1,260 to $1,370 analyst bid zone, which both Nobrainflip and RYKER are actually watching as a buying opportunity, not a catastrophe.
Ethereum Price Prediction 2027: Key Resistance Levels
| Resistance Level | Significance |
| $2,000 | First major wall pullback target after CHOCH confirms |
| $2,470 CHOCH | A 7D close above this flips the entire structure bullish |
| $3,000 | Target 1: good outcome, base scenario |
| $4,000 | Target 2: best realistic outcome, strong cycle |
| $5,000 | Target 3 bull rally, breaks previous ATH of $4,951 |
| $6,000–$8,000 | Full cycle top extended bull run, new ATH territory |
Ethereum Price Prediction 2027: Scenario by Scenario
| Scenario | Condition | ETH Target |
| Good | CHOCH confirms the cycle continues | $3,000 |
| Best Case | Strong second leg, ETF demand grows | $4,000 |
| Bull Rally | ATH breaks, FOMO buying kicks in | $5,000 |
| Full Cycle Top | Everything lines up perfectly | $6,000–$8,000 |
Short-Term Outlook
Right now ETH is at a decision point. The $1,510 to $1,582 support zone either holds or it doesn't. If it holds, the setup starts building toward the CHOCH at $2,470. If it breaks,
The next floor is the $1,260 to $1,370 zone, where analysts are already waiting with buy orders.
Either way, the bears don't have much more room. The oversold readings and the analyst positioning all point to the same thing: accumulation is happening at these levels.
Long-Term Outlook: 2027
Once the CHOCH at $2,470 confirms on the 7D chart, the pullback to $2,000 is the last real buying opportunity before the next leg. After that holds, $3,000 is the first target
A strong cycle takes it to $4,000. A full bull run with ATH breaks gets ETH to $5,000 and then $6,000 to $8,000 in 2027.
The setup is there. The analysts are positioned. The chart structure suggests a potential recovery phase, although confirmation is still required. $1,510 is the line in the sand; watch that level on the weekly close.
Conclusion
ETH is at $1,581 today, sitting on a weekly demand zone that has held multiple times. The CHOCH at $2,470 is the structural trigger that changes everything. Break that on a 7D close, pull back to $2,000, hold it, and 2027 targets of $3,000 to $8,000 come into play depending on how strong the cycle gets.
Several market commentators have highlighted the $1,260–$1,370 region as a potential accumulation zone. The chart is setting up. The only question is whether $1,510 holds or one more flush to $1,260 happens first before the real move begins.
$1,510–$1,582 is the line in the sand. Watch the weekly close. If it holds and $2,470 breaks, 2027 becomes a completely different story for ETH.
Disclaimer: This article is for informational and educational purposes only. It does not constitute financial advice. Cryptocurrency markets are highly volatile. Always do your own research before making any investment decisions.
Also read:
1 month ago
I extend my deepest gratitude to Unique Recovery Firm for their exceptional assistance in recovering my lost funds. Their unwavering professionalism, transparency, and commitment turned my distress into relief. When I had almost given up hope, they stepped in with expertise and compassion, guiding me through every step with confidence and clarity. Their service is not only reliable but also genuinely life-changing. Unique Recovery Firm didn’t just recover my money—they restored my peace of mind. I’m forever thankful for their remarkable work and highly recommend their trusted services. CONTACT INFOEMAIL : uniquerecoveryfirm.-------@-----gmail>.com> Whatapps: + 1 9 1 2 8 3 1 4 0 2 0












.webp)










