SIREN Price Prediction: Why SIREN Price Is Up 110% Today

SIREN Price Prediction: Huge Liquidations vs. Flat Market
SIREN Price Prediction is back in focus as the token pushed toward $1.82, jumping over 110% in the last 24 hours.
The broader market doesn’t reflect that kind of momentum.
Total crypto market cap is sitting near $2.42T with a mild 0.5% uptick, while Bitcoin and Ethereum continue to drift without any strong expansion.
That contrast stands out.
When the market stays relatively steady but one token starts accelerating like this, the move usually comes from internal positioning rather than fresh external demand.
The pace of the move feels fast, almost compressed, as if something unwound quickly beneath the surface.
SIREN is trading in that kind of environment right now.
Liquidations Shift Control Back to Buyers
Crypto Liquidation data adds more context to this move.
As per Coinglass, nearly $2.46M worth of positions were wiped out over the last 24 hours, with short liquidations alone contributing close to $1.93M.
Even on lower time frames, the imbalance remains tilted toward the short side, showing that bearish positioning had built up quite heavily before the reversal began.
At the same time, the volume heatmap reflects where most of this activity is coming from.
Binance dominates with over $560M in volume, while Bybit and Bitget are also seeing strong participation.
The flow looks concentrated across a few major exchanges, which usually leads to sharper price reactions instead of a smooth move.
The earlier decline seems to have pulled in aggressive short exposure, but once the price stopped pushing lower, that positioning began to unwind.
The reaction picked up pace quickly, visible in sharp price movements and sudden bursts across these high-volume platforms.
In this kind of setup, price often stretches a bit more than expected, not because of strong conviction, but because positions are being forced to adjust.
The current move still carries that same tone, where momentum feels reactive rather than fully stable.
Whale Concentration Behind SIREN’s Fast Price Move
As per insights shared by BSC News, nearly 88% of SIREN’s supply is held within a single wallet cluster, pointing to a highly concentrated structure.
That kind of setup usually raises concerns, but it also helps explain why the current move is reacting faster than expected.
The tweet further highlights that this accumulation came from a single entity, which aligns with the recent sharp price behavior.
Limited supply available in open circulation
Large holder influence on short-term direction
Price reacts faster once momentum builds
With supply tightly held, upward moves can extend quickly when pressure builds.
At the same time, this structure keeps the downside risk active if that supply starts to move.
Why SIREN Price Is Up Today: Technical Outlook and Key Levels
On the chart, the structure has been changed after yesterday’s sharp fall.
Price dropped aggressively, but instead of continuing lower, it found stability around the 100 EMA zone near $0.75.
That area acted less like a clean support and more like a pause, where the price stayed compressed for a while.
The movement there looked uncertain, almost like accumulation mixed with hesitation.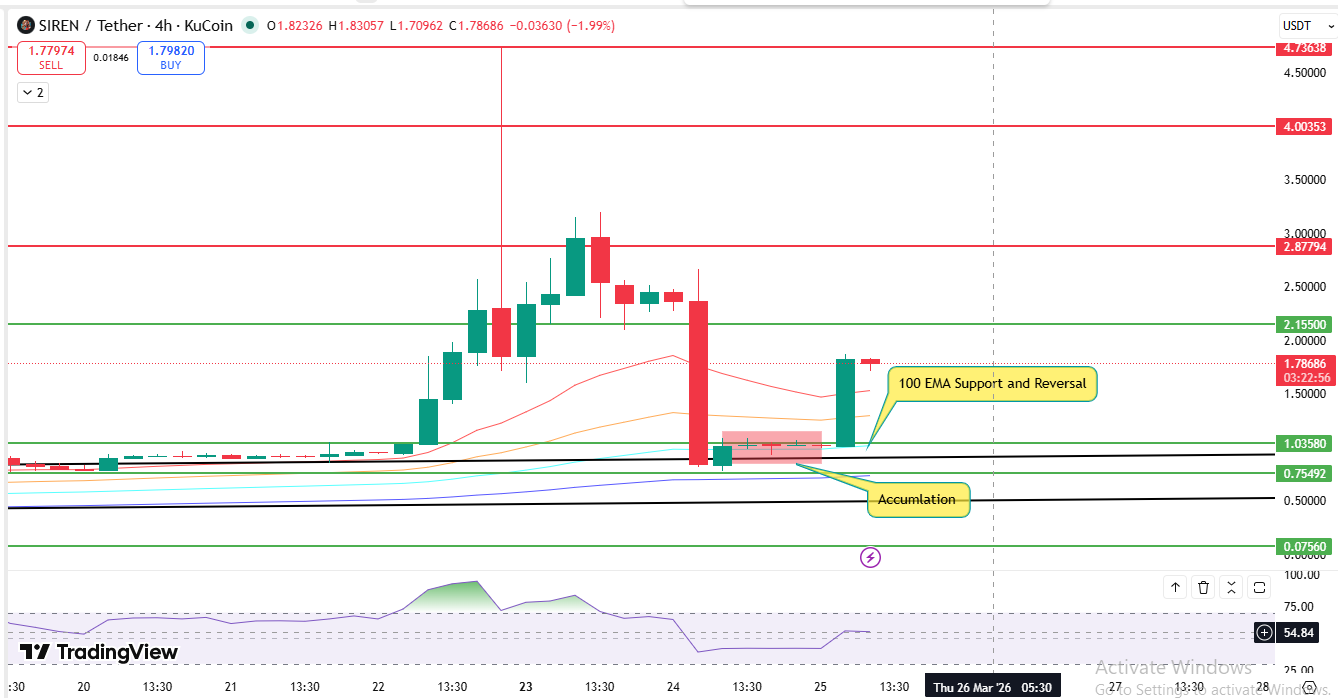
After that phase, the reaction started building.
Price pushed upward again, repeatedly respecting the same EMA zone as support.
The latest rally came with a strong 4-hour candle, suggesting that buyers stepped in with intent once the base was formed.
RSI is currently near 54, which keeps it in a neutral-to-bullish range. The move doesn’t look stretched yet, at least from a momentum perspective.
Key Support and Resistance Levels
Support Levels:
$1.03 → immediate support
$0.75 → major accumulation zone
$0.50 → downside risk level
Resistance Levels:
$2.15 → first key barrier
$2.87 → previous rejection zone
$4.00 → higher breakout level
Right now, the move is holding structure, but it still depends on whether price can sustain above the immediate support.
SIREN Short-Term Price Prediction
The current move looks driven by positioning and technical reaction rather than strong trend confirmation.
If price continues to hold above the $1.03 zone, the upside could extend toward $2.15 in the near term
A break above that level may open space toward $2.80–$3.00, but that would likely need continued volume support.
On the downside, if price slips below $1.03 again, the structure weakens.
In that case, a revisit toward the $0.75 zone remains possible, where the last base was formed.
Short-term, the market is still reacting.
Direction is forming but not fully established.
SIREN Long-Term Price Prediction: Bull, Base and Bear Scenarios
The longer-term outlook depends less on short-term momentum and more on how supply and participation evolve over time.
Bull Case: If accumulation continues and large holders maintain control without heavy selling, price could gradually expand toward the $4.00–$6.00 range.
Sustained exchange activity and speculative interest would be required to support this move.
Base Case: If momentum cools down and the market stabilizes, the price may trade in a broader range between $1.50 and $3.50.
This would reflect a more balanced phase with both buying and selling pressure.
Bear Case: If supply starts rotating out or sentiment weakens, the structure could break down again.
In that scenario, price may drift back toward the $0.50–$1.00 range, especially if demand fails to absorb selling pressure.
Expert View
SIREN Price Prediction currently leans more on positioning shifts than strong fundamental backing.
The recent move reflects a mix of short liquidations, concentrated supply, and technical support holding at key levels.
While the upside looks active, the structure still feels reactive rather than fully stable.
Analysis suggests that the market is in a transition phase, where price is trying to establish a base after a sharp imbalance.
This analysis considers market behavior, liquidity shifts, token concentration, and recent price structure.
If momentum continues, the upside may extend further.
But if positioning normalizes, volatility is likely to remain.
Disclaimer: Cryptocurrency markets are highly volatile. This analysis is for informational purposes only and does not constitute financial advice. Investors should conduct their own research before making decisions.


