- News
- Price Prediction
- Press Release
- Crypto Airdrop ›
- Presale / ICO ›
- Events
- Listing
- Tools ›
- Casino ›
-


The crypto market has taken a sharp turn, and this time the pressure feels broader than usual.
The latest drop has pulled major assets into focus, making the Bitcoin, Ethereum, XRP, and Solana price crash today a key discussion across trading circles.
Bitcoin has slipped over 5%, now trading near $70,224, dragging sentiment lower across the board.
Ethereum is facing even steeper losses, down more than 6.65% to around $2,167.
XRP has dropped to $1.46, while Solana is also under pressure, trading near $89.52 after a 4.92% fall.
This is not just a single-coin reaction.
The weakness is spreading across the market, and the speed of the move is raising concerns.
The real question now is whether this is a temporary shakeout… or something deeper is unfolding.
The current market drop is not driven by a single factor.
Instead, multiple macro and market forces are hitting at the same time, creating a chain reaction across crypto assets.
The Fed's Hawkish Hold: In the latest FOMC meeting, the Federal Reserve kept interest rates steady at 3.5% but raised inflation projections from 2.4% to 2.7%.
This signals fewer rate cuts in 2026, putting pressure on risk assets like crypto as liquidity expectations tighten.
Middle East Tensions: The rising Iran-Israel conflict has pushed oil prices above $113, increasing inflation concerns.
As a result, investors are rotating toward safer assets like gold and bonds, reducing exposure to crypto.
Massive Liquidations: According to CoinGlass data, total liquidations crossed $576 million in the past 24 hours, with a large portion coming from long positions.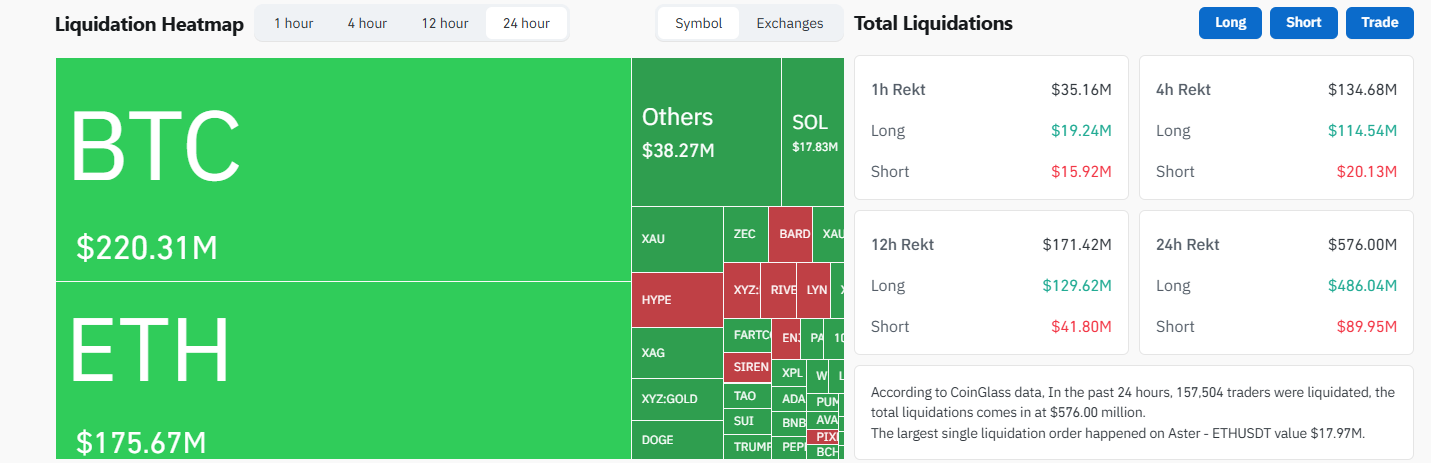
The drop in Bitcoin to around $70,224 and Ethereum to $2,167 triggered forced sell-offs, accelerating the market-wide decline.
On the 4-hour chart, Bitcoin was previously moving inside a rising channel, showing a steady upward structure.
However, the trend shifted after price faced rejection near the $76,000 zone.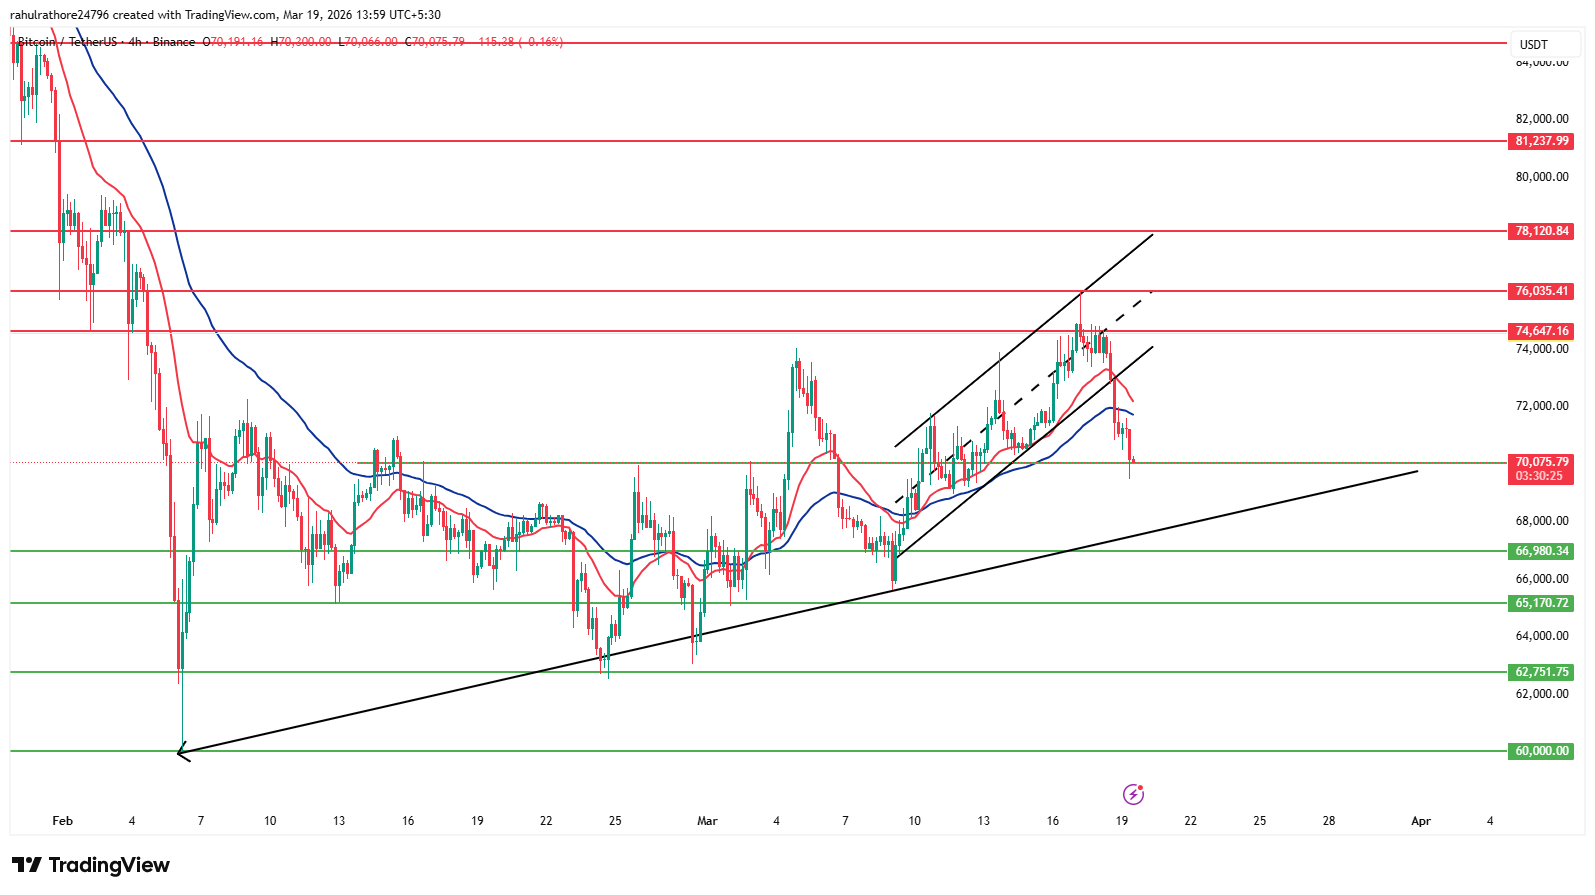
That rejection led to a breakdown from the rising channel, which has now changed the short-term momentum.
Since then, price has been sliding lower and is currently trying to stabilize around the $70,000 support zone.
Another important signal is forming around the moving averages.
The 21 EMA and 50 EMA are now moving closer, hinting at a possible bearish crossover. This shift suggests that short-term strength is fading.
After the $70,000 breaks, the next key area to watch is the rising trendline, which could act as the next support zone.
Immediate support: $70,000
Next downside levels: Rising trendline → $66,980 → $65,000
Resistance zone: $74,600–$76,000
Trend signal: Potential bearish EMA crossover
If the $70,000 level breaks with confirmation and the bearish crossover completes, downside pressure may increase further.
For now, this zone is acting as a key decision point for the next move.
On the 1-hour TradingView chart, Ethereum showed a rounded recovery from the $2,000 zone, pushing price toward the $2,400 level.
However, that move faced rejection, and momentum started to fade.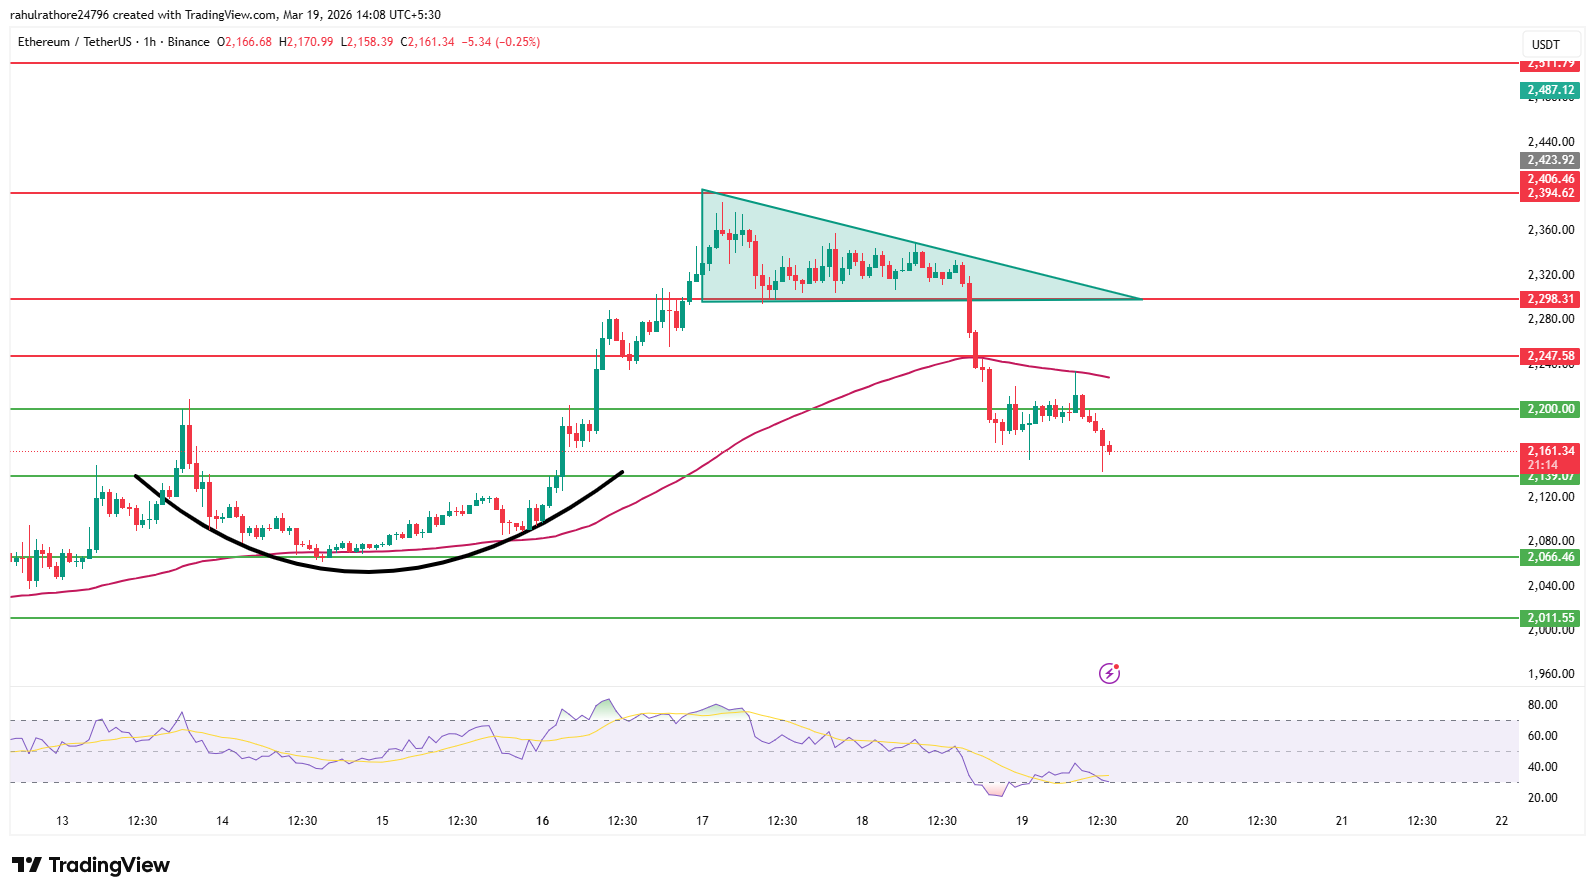
After the rejection, price moved into a descending triangle pattern, which typically reflects selling pressure building over time.
That structure eventually broke down, confirming weakness in the short term.
The breakdown below the $2,250 support added further pressure, and price also slipped below the 100 EMA, showing a shift in trend.
Current support: $2,140
Next downside levels: $2,066 → $2,000
Resistance zone: $2,250–$2,300
Trend signal: Breakdown below triangle + 100 EMA
If the $2,140 level fails to hold, further downside toward lower supports may open up.
For now, price is still searching for stability after the breakdown, with sellers maintaining control in the short term.
On the 4-hour chart, XRP was previously moving upward after taking support near the $1.35 zone, forming a rising wedge pattern.
This structure showed gradual upside but also hinted at weakening momentum.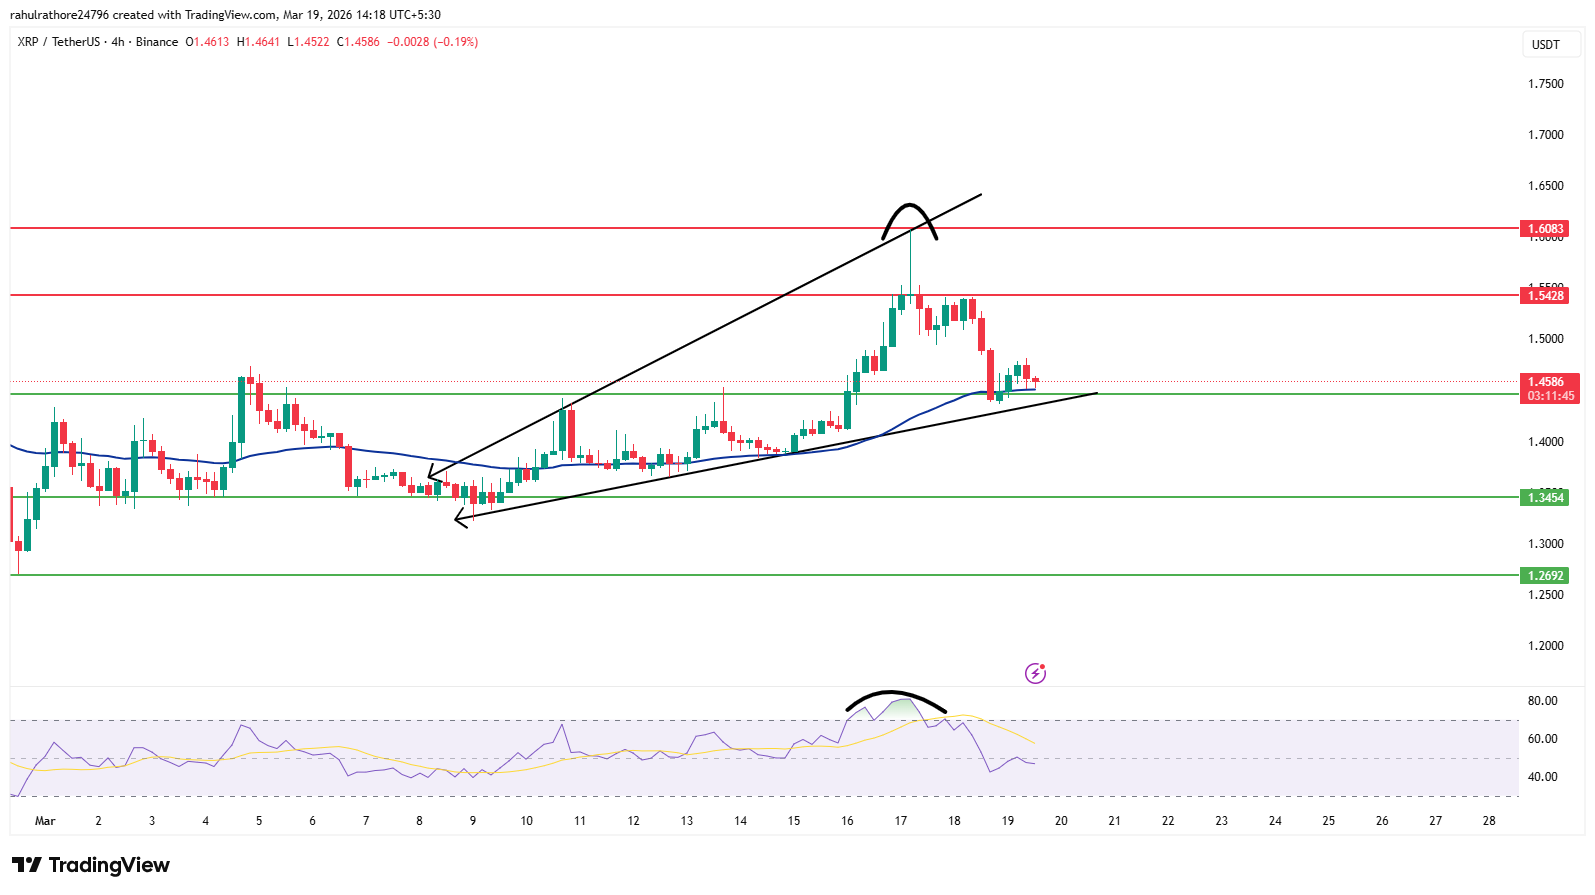
The price faced strong rejection near the $1.60 resistance, where selling pressure kicked in.
At the same time, RSI was in the overbought zone, which added to the probability of a pullback.
Since then, price has started moving lower and is now approaching a key support area around the 50 EMA and the $1.45 level.
Immediate support: $1.45 (with 50 EMA)
Next downside levels: $1.35 → $1.26
Resistance zone: $1.54–$1.60
If price stabilizes around the current support, a short-term reversal may be possible.
However, if both the 50 EMA and $1.45 support break, further downside toward lower levels could follow.
On the 4-hour chart, Solana had earlier broken out of an ascending triangle, which pushed the price higher.
However, the move lost strength near the $95–$96 resistance zone, where selling pressure came in.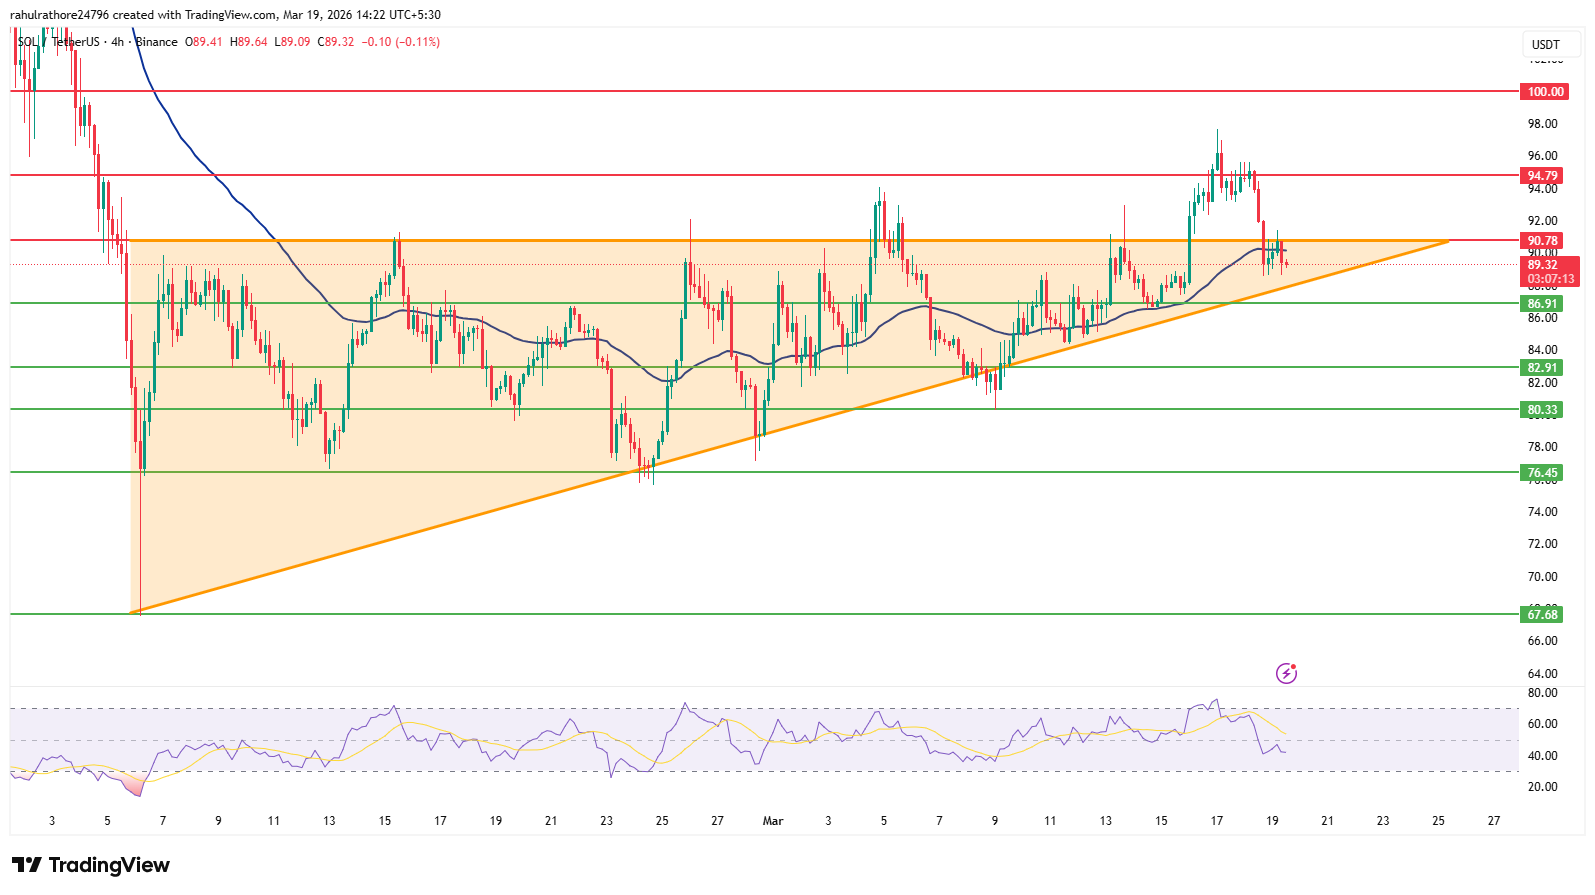
After facing rejection, price has moved back inside the triangle structure, showing that the breakout could not sustain.
This shift is now putting the trend under pressure.
Immediate support: $86
Next downside levels: $82 → $80
Resistance zone: $90–$96
Trend signal: Failed breakout + triangle retest
If the price breaks down from this triangle, the lower support levels may come into play quickly.
For now, the structure is holding, but momentum has clearly weakened after the rejection.
The current market drop is not just a random move. Macro pressure, geopolitical tensions, and liquidations have all come together, weakening overall sentiment.
Bitcoin near $70,000 is now the key level to watch. If it breaks, downside pressure could spread further across Ethereum, XRP, and Solana.
At the same time, prices are approaching important support zones, where a reaction is possible.
For now, the market looks cautious, not fully broken, but still far from stable.
Disclaimer: Cryptocurrency markets are highly volatile. This price prediction is based on technical structure and current developments, not financial advice. Investors should conduct independent research and assess their risk tolerance before making any decisions.


Owned by:-
DCG Tech FZCO, UAE
Delivery Partner:-
Gabbar MediaTech Pvt Ltd.
Copyright © 2026 Coin Gabbar. All Rights Reserved