XRP Price Prediction: 5 Catalysts That Could Push It Past $2 This Week

XRP Faces 5 Make-or-Break Events That Could Push It to $2
Can XRP finally escape the tight range it has been stuck in for weeks? Right now, five major XRP price catalysts are hitting the market between Wednesday and Friday, and any one of them could trigger a sharp move. The altcoin is trading near $1.45, making $XRP analysis today especially important as traders watch regulatory developments, Federal Reserve signals, geopolitical risks, and ETF flows.
For anyone tracking the $XRP price prediction today or asking, will XRP go up tomorrow, the next 72 hours could provide important clues. The key question is whether these catalysts can push it above resistance or send it back toward major support.
Where Is $XRP Trading Today? Key Levels to Know
$XRP is sitting around $1.45, roughly 62% below its all-time high near $3.84. The price dipped after a May 10 high but has not broken the key low near $1.38.
From a technical perspective, the XRP support and resistance structure remains clear. The $1.40–$1.42 zone is the first support area, while $1.38 is the critical level bulls need to defend. A break below $1.38 could expose the next major floor near $1.12.
Traders are also watching RSI, moving averages, Fibonacci levels, and trading volume for confirmation. These indicators will help determine whether the current setup is bullish or bearish rather than relying only on headline catalysts.
5 $XRP Price Catalysts That Could Move the Market
Five major $XRP price catalysts are lining up in the same 72-hour window. Here is what each one could mean for the XRP price.
| Catalyst | Status | Bullish Trigger | Bearish Risk |
|---|---|---|---|
| CLARITY Act | Pending | Clean regulatory progress | Bill stalls or weakens |
| Fed Chair Kevin Warsh | Pending | Dovish policy signals | Hawkish inflation comments |
| Fed Speakers | Pending | Lower-rate expectations | Higher-for-longer rates |
| Iran Talks | Pending | De-escalation and lower oil | Escalation and inflation fears |
| XRP ETF Flows | Ongoing | Strong net inflows | Sustained outflows |
1. CLARITY Act
The CLARITY Act markup on Thursday is one of the biggest $XRP price catalysts this week. A clean regulatory outcome could improve sentiment and potentially help $XRP challenge $1.80.
If regulatory progress stalls or the bill is significantly watered down, the market could lose some of its regulatory premium, putting pressure on price.
2. Fed Chair Kevin Warsh
Kevin Warsh is scheduled to be sworn in as the new Fed Chair on Friday. His initial comments could influence the dollar, interest-rate expectations, and broader risk assets.
A dovish tone could support crypto markets, while a hawkish stance focused on persistent inflation could pressure $XRP and other risk assets.
3. Fed Speakers and Bond Yields
Fed speakers are active from Wednesday through Friday before the FOMC blackout period. Their comments on inflation and interest rates could influence market sentiment for the coming weeks.
The 10-year Treasury yield is another important indicator. A move below 4.40% could support risk assets, while a sustained move above 4.55% could create pressure across crypto markets.
4. Iran Talks
Geopolitical developments could also become a short-term $XRP price catalyst. A resumption of talks could ease oil and inflation concerns, potentially supporting risk assets.
However, escalation could push oil prices higher and revive inflation fears, creating a negative backdrop for XRP.
5. XRP ETF Inflows
ETF flows remain one of the most important factors in the current XRP forecast. Seven U.S. $XRP ETFs reportedly hold more than 848 million tokens, with cumulative inflows reaching approximately $1.36 billion.
According to the supplied SoSoValue data, May 12 recorded around $25.8 million in new inflows, the strongest daily inflow since January. Traders should monitor the weekly $XRP ETF net flow closely because continued positive flows could strengthen demand, while sustained outflows would be a warning signal.
$XRP Wallet Growth: What Is On-Chain Data Saying?
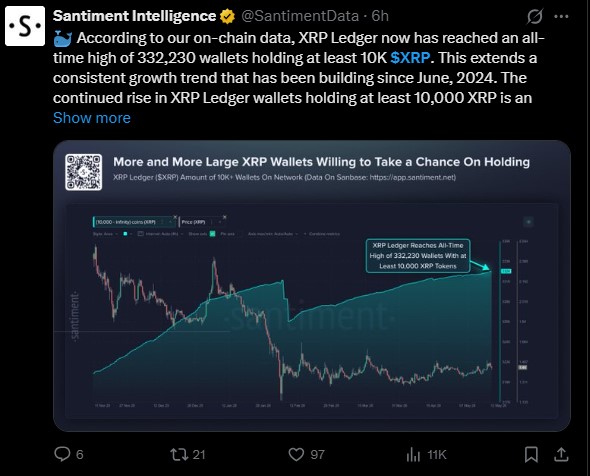
On-chain data provides another bullish signal. $XRP Ledger wallets holding at least 10,000 tokens reportedly reached a record 332,230.
The steady growth in larger XRP wallets since June 2024 suggests that some larger holders have continued accumulating through periods of market weakness. However, wallet growth alone does not guarantee future price appreciation and should be considered alongside volume, RSI, moving averages, and broader market conditions.
XRP Technical Analysis: What Is the Model Watching?
The current technical analysis combines four key indicators: RSI, EMA or moving-average structure, MVRV, and trading volume.
RSI helps identify whether momentum is becoming overbought or oversold. Moving averages help confirm the broader trend. MVRV can provide insight into whether holders are sitting on significant unrealized gains or losses, while volume helps confirm whether a breakout has genuine participation.
A bullish setup would ideally require it to hold $1.38, reclaim $1.45 with stronger volume, and eventually break the $1.80 area. A sustained move above resistance would strengthen the price target toward $2 and beyond.
XRP Price Prediction: Bull, Base, and Bear Cases
| Scenario | Price Target | Probability | Key Assumption | Invalidation Level |
|---|---|---|---|---|
| Bear Case | $0.90–$1.20 | 25% | Catalysts disappoint and support breaks | Weekly close below $1.38 |
| Base Case | $1.40–$2.15 | 50% | Mixed catalysts keep it range-bound before breakout | Sustained weakness below $1.38 |
| Bull Case | $2.15–$3.80 | 20% | Regulatory progress, strong ETF flows, risk-on market | Failure to reclaim $1.45 |
| Extreme Bull | $3.80+ | 5% | Strong crypto cycle and major capital rotation | Long-term momentum fails |
The price prediction this week therefore depends heavily on the $1.38–$1.45 zone. Holding support and breaking resistance would strengthen the bullish case, while losing $1.38 could shift attention toward $1.20 and potentially $1.12.
XRP Forecast: What Are Analysts Targeting?
Named analyst forecasts show how wide the potential outcomes can be. Standard Chartered has previously outlined a bullish long-term view, while EGRAG CRYPTO has discussed significantly higher cycle targets in the $7–$10 range.
These forecasts should not be treated as guaranteed outcomes. They represent different assumptions about regulation, institutional adoption, ETF demand, liquidity, and the broader crypto cycle.
For investors asking, is it a good buy right now, the answer depends on risk tolerance and whether the current support structure holds. The market still needs confirmation before a stronger trend can be established.
XRP Price Prediction Summary: What Happens Next?
The current analysis today points to a market waiting for confirmation. The five major price catalysts — regulatory developments, Fed policy signals, geopolitical news, and ETF flows — could determine whether it breaks higher or revisits lower support.
The bull case requires it to defend $1.38, reclaim $1.45, and eventually break $1.80 with stronger volume. The bear case begins with a decisive loss of $1.38, exposing $1.20 and $1.12.
For a broader breakdown of the key XRP support and resistance levels, traders can also review the latest technical zones and major breakout levels shaping the price outlook.
The most important question for the price prediction this week is simple: can the catalysts create enough demand to push it through resistance? Until the data confirms the direction, traders should define their risk and let price action decide.
These five price catalysts could shape the token's short-term direction, but the bigger picture will depend on whether it can hold key support and turn resistance into support. For a broader outlook on the year's potential targets, scenarios, and technical levels, see our XRP price prediction 2026 analysis.
Financial Risk Disclaimer: This article is for informational and educational purposes only and does not constitute financial, investment, or trading advice. Cryptocurrency markets are highly volatile and speculative. Always conduct your own research and consult a qualified financial advisor before making investment decisions.
Also read:

















