XRP Chasm Zone Analysis: Will $1.11 Hold Before a Big Rally?

Updated: July 23, 2026
Change Note: This XRP chasm zone analysis update adds clearer Chasm-zone context, refreshed support levels, bull/base/bear scenarios, ETF-flow considerations, and a stronger bridge to the XRP price prediction 2026 outlook.
Refresh Cadence: Weekly during major catalyst periods; monthly for evergreen technical sections.
What if the thing everyone is watching about $XRP is not actually the most important thing? Most crypto traders are focused on where it will go next — $10, $15, maybe $27. But the analysts who called the last big move are saying the real story right now is happening at the bottom, not the top.
This $XRP chasm zone analysis focuses on the critical $1.11 area and whether it can build a sustainable base before attempting a larger breakout. XRP is sitting inside what chart analysts are calling a "Chasm" zone. It is not a standard technical-analysis term, but in this analysis, it refers to a broad and uncertain price range where buyers and sellers are fighting for control.
Whether the altcoin holds this area or breaks further down could set the tone for the rest of the cycle. For a broader outlook, traders can also review XRP price prediction 2026 alongside the latest technical signals.
What Is the $XRP "Chasm" and Why Does It Matter?
The Chasm is a term used by market analysts to describe a wide, uncertain price range on a long-term chart — an area where price can move sharply and confuse most traders.
Think of it as a fork in the road. Either it finds solid ground here and launches, or it slips further before finding real support.
According to well-followed crypto analyst EGRAG CRYPTO, the Fibonacci levels within this Chasm zone mark possible stopping points for the current pullback.
The first level at $1.11 is considered the most important. If it holds above this price and shows buying strength, analysts believe the correction could be ending, potentially opening the door to another major move higher. If $1.11 breaks decisively, traders need to watch $0.80 next.
This makes the current XRP support and resistance levels especially important. A sustained hold above $1.11 would strengthen the bullish case, while a breakdown could shift the market toward a deeper accumulation phase.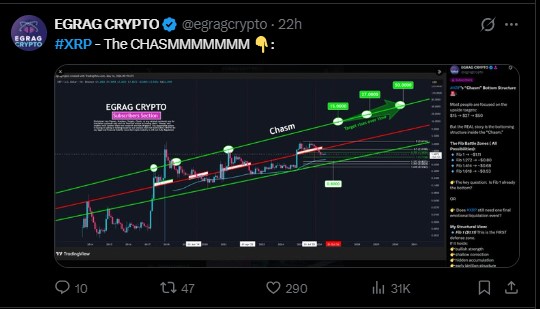
Is $XRP Already at the Bottom?
This is the big question the market is asking right now. Some analysts believe it has already found its floor and that the current price area could become a long-term accumulation window. Others think one final sharp drop — often called an "emotional liquidation event" — could happen before the real rally begins.
"The key question is simple: Is Fib 1 at $1.11 already the bottom — or does it still need one final emotional liquidation event before it ignites?"
— EGRAG CRYPTO analysis, May 2026
In past market cycles, $XRP has shown a tendency to shake out weak hands with sharp declines before major recoveries. That pattern is one reason the current setup remains interesting, although historical behavior does not guarantee the same outcome this time.
Bullish Signs Supporting the Bottom Theory
- $XRP is still holding a confirmed breakout against Bitcoin on long-term charts.
- Accumulation patterns are visible around current price levels.
- Shallow correction signals could suggest larger buyers are becoming active.
- The $1.11 Fibonacci zone is acting as an early ignition structure.
- $XRP trading volume and whale accumulation should be monitored for confirmation rather than assuming a bottom based on price alone.
$XRP vs Bitcoin: The +800% Signal Traders Are Watching
While most people trade $XRP against the US dollar, some analysts track its performance against Bitcoin. That chart is telling a very different story.
Analyst Javon Marks recently pointed out that it has broken out of a massive long-term descending triangle on the XRP/BTC chart.
Breakouts like this, when they fully play out, have historically produced gains approaching 800% from the breakout point, according to the analyst's interpretation.
If a similar move occurs, a price above $10 becomes a possible long-term target. With an extended target beyond $15, the math starts making sense for long-term holders who have been waiting for a larger cycle expansion.
However, these are technical projections rather than guaranteed price targets. $XRP would need sustained momentum, stronger liquidity, and a supportive broader crypto market for such a move to develop.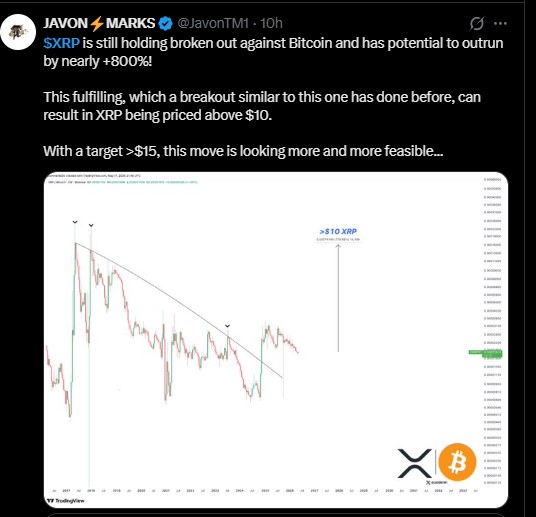
XRP Price Prediction: Upside Targets If the Bullish Case Holds
If it successfully defends the Chasm zone and the broader crypto market remains supportive, analysts have laid out a potential roadmap for where XRP could travel.
These targets align with historical Fibonacci extension levels, long-term chart structures, and $XRP's relationship with Bitcoin.
The $15 level is especially significant because it represents a major resistance area after a successful breakout from the Chasm.
Reaching $27 would require sustained momentum, strong trading volume, and continued capital rotation into $XRP. The $50 target represents an extreme bull-market scenario that would likely require a much larger overall crypto market and substantial institutional demand.
For context, the broader $XRP price prediction 2026 outlook also depends on whether it can establish a durable base before the next major market expansion.
$XRP Bull, Base and Bear Case
The following scenario model is based on the $1.11 support zone, broader Fibonacci structure, RSI and moving-average confirmation, trading volume, and market liquidity. These probabilities are scenario estimates, not statistical guarantees.
| Scenario | Potential Range | Probability | Key Trigger | Invalidation |
|---|---|---|---|---|
| Bull Case | $15–$27+ | 25% | $1.11 holds, breakout confirms, volume expands | Sustained loss of major support |
| Base Case | $2.80–$10 | 50% | Gradual recovery and broader crypto strength | Repeated rejection and weak liquidity |
| Bear Case | $0.53–$0.80 | 25% | $1.11 fails and selling accelerates | Strong reclaim of $1.11 with volume |
The model does not rely on a single indicator. RSI would help identify momentum exhaustion, moving averages would confirm trend direction, Fibonacci levels define potential support and resistance, while trading volume would help determine whether a breakout has real participation. MVRV and ETF flows can provide additional context on market positioning and institutional demand.
The Bearish Risks You Cannot Ignore
No honest XRP analysis skips the risks.
If $XRP loses the $1.11 support, a drop toward $0.80 becomes the next major area to watch. A broader Bitcoin correction could pull XRP lower regardless of its own chart structure.
Regulatory uncertainty around Ripple and XRP remains a background risk that can trigger sudden selling. Thin market volume during sideways periods could also allow a sharp wick toward $0.53, potentially flushing out leveraged positions.
Investors should understand that $XRP has historically experienced extreme moves in both directions. The same volatility that creates opportunities can also produce significant losses.
What Should You Watch Right Now?
If you are following $XRP closely, the most important thing to monitor is price behavior around $1.11.
A strong hold and bounce from this area would provide the clearest bullish confirmation. But traders should also look for increasing buying volume rather than relying only on price stabilization.
The XRP RSI, moving averages, and trading volume can help determine whether the market is actually recovering or simply experiencing a temporary bounce.
ETF flows are another important factor. A sustained period of positive XRP ETF net flows could strengthen the demand narrative, while renewed outflows would make the bullish thesis harder to sustain.
For a broader view of the market structure, traders can also compare this setup with the latest $XRP support and resistance levels and monitor whether major resistance zones are being reclaimed.
Beyond charts, Bitcoin remains crucial. A strong Bitcoin breakout could provide the liquidity needed for XRP to move toward higher Fibonacci targets, while a sharp BTC correction could invalidate the bullish setup.
A Bitcoin breakout above key resistance could provide additional support for XRP's broader bullish setup.
XRP Price Prediction: Is $15 Realistic?
The $15 target is not a guaranteed forecast. It is a technical projection based on the potential completion of long-term chart structures and Fibonacci extensions.
For XRP to reach $15, the token would likely need to first defend $1.11, reclaim important resistance levels, attract stronger trading volume, and benefit from a broader crypto bull market.
The $27 and $50 targets are significantly more speculative and would require increasingly favorable market conditions.
Standard Chartered's more conservative institutional outlook has previously pointed toward a much lower target around $2.80, while EGRAG's cycle-based views have included substantially higher $7–$10 or more aggressive scenarios. This difference highlights how widely $XRP forecasts can vary depending on assumptions and time horizons.
Final Thoughts: $XRP Is at a Crossroads
$XRP is at one of the most important decision points in its recent history.
The Chasm zone is testing the patience of holders, and short-term pain remains possible. But the long-term picture, based on the breakout structure against Bitcoin and the Fibonacci roadmap analysts are tracking, still points toward potentially higher prices if the bullish setup confirms.
The $15 target is a technical possibility, not a certainty. Whether it reaches that level directly or experiences another shakeout first remains unknown.
For now, $1.11 is ground zero. A confirmed hold could strengthen the bullish case, while a decisive breakdown would shift attention toward $0.80 and potentially $0.53.
The key is to let price action confirm the narrative rather than assuming the biggest target will automatically arrive.
This article is for informational purposes only and does not constitute financial advice. Cryptocurrency markets are highly volatile. Always do your own research before making any investment decisions. Past performance does not guarantee future results.







.webp)








