As markets shut down for Good Friday and the weekend, Bitcoin is still consolidating between important resistance zones. Could it be on the verge of a breakout?
Crypto markets have recorded minimal movement due to Good Friday and the coming weekend. With international financial markets closed, Bitcoin (BTC) has recorded a 0.64% gain, while Ethereum (ETH) drifted slightly downwards by $0.50. The overall market cap of crypto is hovering just above $2.66 trillion, marking a 0.58% increase.
Yet, beneath the surface, bullish signals are building. U.S. President Donald Trump recently hinted at making a trade deal with China — a development that could ease global tensions and fuel market optimism.
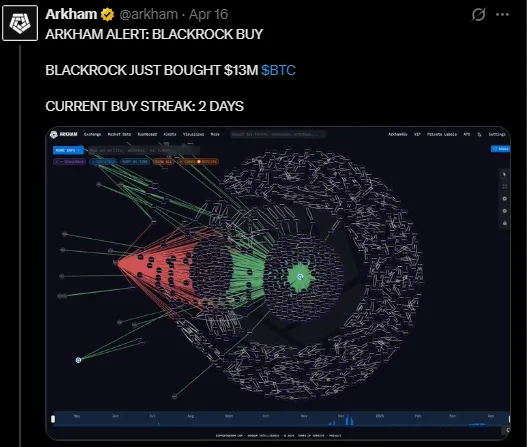
Adding to this, BlackRock made headlines with a fresh $30.7 million BTC purchase, according to Arkham Intelligence. That’s a strong vote of confidence from one of the world’s largest asset managers.
Technical Analysis: Those signs are a bullish breakout
1. Falling wedge breakout confirms bullish structure
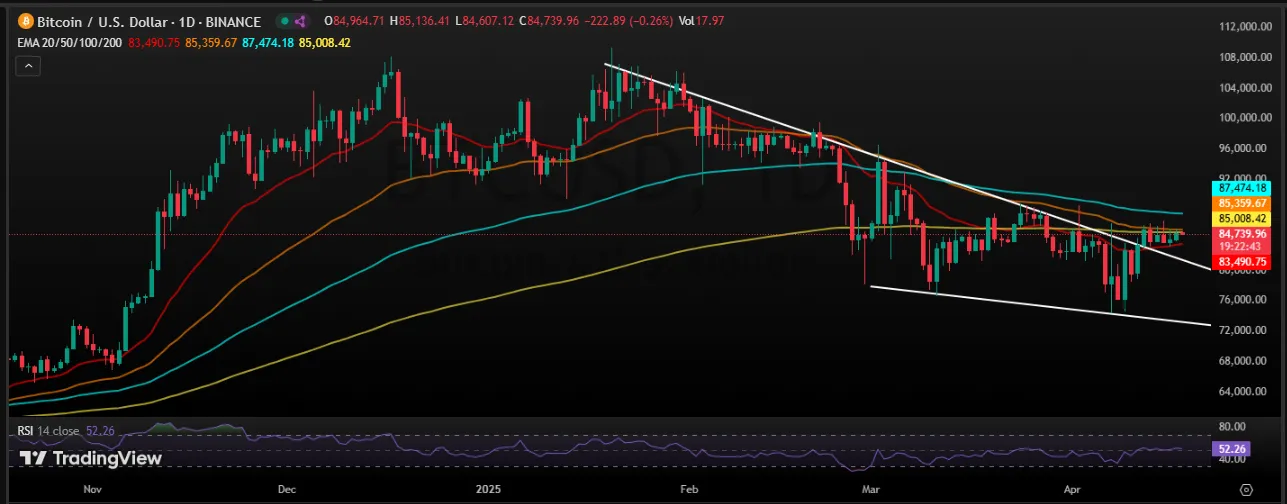
Bitcoin has escaped the falling wedge that forms a classic bullish reversal pattern. This has drawn from the beginning of February to the middle of April, showing that recent price actions might be poised toward upward trends.
2. EMA cluster and resistance test in play
BTC is currently higher than the 20-day EMA and is testing both the 50-day and 100-day EMAs. The levels to watch are the 200-day EMA at $85,359 and the further resistance at $87,474. This value lines up closely with the 100 EMA.
3. Support zones to watch
The first immediate support can be found at $83,490, with a deeper psychological support at approximately $80,000. That previous resistance from the wedge is now seen to have turned into a solid support base for the next move.
4. RSI Analysis: Room to Grow
The Relative Strength Index (RSI) currently hovers at 52.26, reflecting neutral momentum. This gives Bitcoin plenty of room to climb before getting into overbought territory.
Smart money is still moving into BTC. BlackRock's very recent purchase of $30.7 million in Bitcoin isn't just a number- it's an indicator. This is not how institutional money moves unless a big upside is expected.

When combined with much less geopolitical tensions and the growing worldwide demand for decentralized assets, this phase of accumulation would most likely lead to a significant breakout.
Bullish Scenario
A closing for Bitcoin above $85,000 resistance with further confirmation of support above 100 EMA at $87,474 could be the foundation on which to build a bullish trend ascendant towards $90,000-$92,000, and may even spur enough bullish momentum to trigger retesting of the $96,000-100,000 zone previously seen during the 2021 highs in a bull market.
Bearish Scenario
If BTC does not hold on to the support at above $83,500 and trades below $82,000, then it may well revisit the consolidation zone of $78,000-76,000, delaying the breakout and leading BTC to move sideways until the resumption of stronger buying.

Source: TradingView

Lokesh Gupta is a seasoned financial expert with 23 years of experience in Forex, Comex, NSE, MCX, NCDEX, and cryptocurrency markets. Investors have trusted his technical analysis skills so they may negotiate market swings and make wise investment selections. Lokesh merges his deep understanding of the market with his enthusiasm for teaching in his role as Content & Research Lead, producing informative pieces that give investors a leg up. In both conventional and cryptocurrency markets, he is a reliable adviser because of his strategic direction and ability to examine intricate market movements. Dedicated to study, market analysis, and investor education, Lokesh keeps abreast of the always-changing financial scene. His accurate and well-researched observations provide traders and investors with the tools they need to thrive in ever-changing market conditions.