Bitcoin Price Prediction 2029: Will BTC Reach $300,000?


What Matters For Bitcoin Price Prediction 2029
Bitcoin is trading at $60,324, right back on the same monthly trendline that once fired off a 410% rally.
This Bitcoin Price Prediction 2029 breakdown looks at that trendline, the ETF outflow pressure building in the background, and what a repeat breakout could mean for BTC's next multi-year move.
BTC Right Now:
| Metric | Value |
| Current Price | $60,324.36 |
| Market Cap | $1.21T |
| 24h Volume | $40.31B (3.33% of Mkt. Cap) |
| Total Supply | 20,050,975 BTC |
| Circulating Supply | 20,050,975 BTC |
$BTC price is up 2.62% on the day, and volume relative to market cap is sitting at a fairly normal 3.33%. Nothing dramatic yet, just a market holding steady while it decides its next direction.
Bitcoin Price Prediction 2029: ETF Flows Tell a Quieter Story
The spot Bitcoin ETF data paints a more cautious picture than the price chart does. 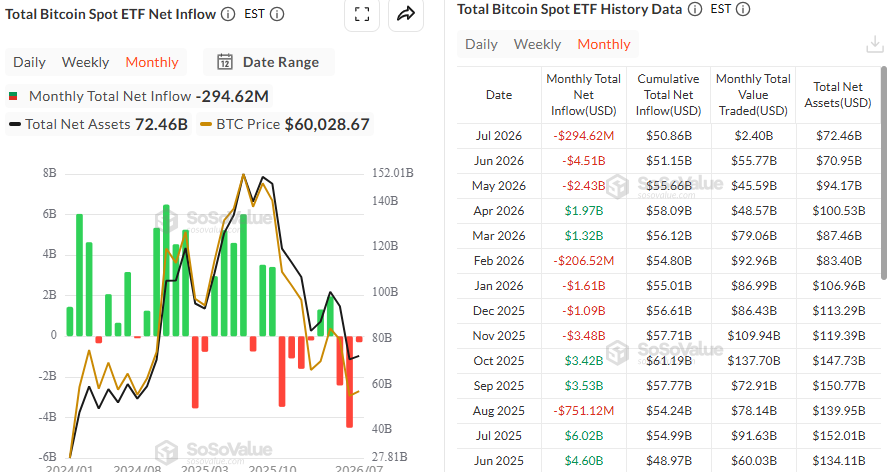
June's much larger $4.51B outflow and May's $2.43B outflow. Total net assets across the ETFs now sit at $72.46B as of 1st july 2026
Zoom out and the pattern is choppy rather than one-directional.
March and April 2026 both saw solid inflows, over $1.3B and $1.97B, respectively, before the market flipped back into outflow mode for three straight months.
Compare that to mid-2025, when July and June alone pulled in over $10B combined, and it's clear institutional appetite has cooled off from its peak.
That doesn't mean conviction is gone; it just means big money is being more selective about when it steps in, and right now it's mostly sitting on the sidelines, waiting for confirmation.
Bitcoin Price Prediction 2029: BTC Tests a Historic Monthly Support Zone
Pull up the BTC monthly chart, and there's a single ascending trendline running from the 2022-2023 lows all the way to today. 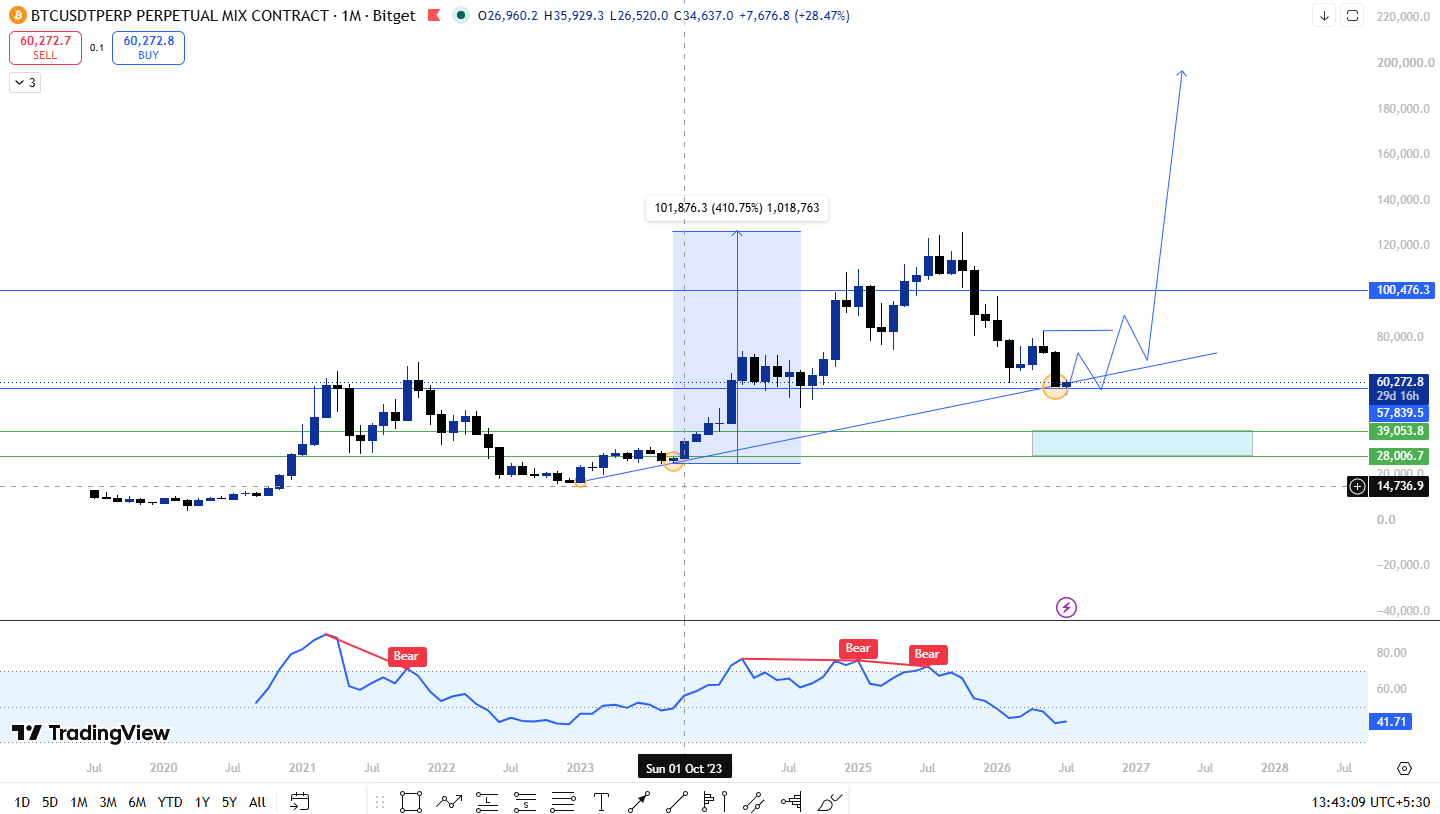
The first time price tapped this line, back in late 2023, it triggered a 410.75% move, carrying BTC from roughly $20,000 up to just over $126,000+ before the rally cooled off.
After that run, BTC pulled back. This is the second real test of that support level on the monthly timeframe, and how BTC reacts here matters a lot for where the next multi-year cycle heads.
The monthly RSI backs up the cautious mood. It's currently reading 41.75, well off overbought levels, and the chart shows bearish divergence stamped across the last two major highs, with price pushing higher while the RSI fails to confirm them.
That kind of setup usually points to fading momentum rather than an imminent blow-off top, which lines up with a market that needs to build a proper base before it can run again.
Bitcoin Price Prediction 2029: BTC Targets for the Next Cycle
| Timeframe | Scenario | Min Target | Max Target | Key Trigger |
| Late 2026 | Trendline Defense | $50,000 | $65,000 | Monthly support holds |
| 2027 | Base Building | $65,000 | $95,000 | ETF inflows turn positive again |
| 2028 | Breakout Attempt | $95,000 | $140,000 | New highs confirmed, RSI resets |
| 2029 | Cycle Peak Zone | $140,000 | $300,000 | Institutional demand returns, full altseason backdrop |
These price projections are not guaranteed and are based on technical analysis, historical trends, and market assumptions. Actual Bitcoin prices may vary significantly.
Risk and Reward: The Honest Version
| Factor | Bull Case | Bear Case |
|---|---|---|
| Monthly Trendline Support | Holds again, sparks another leg up | Breaks open deeper pullback |
| ETF Flow Trend | Outflows reverse into steady inflows | Outflows persist, demand stays weak |
| RSI Bearish Divergence | Resolves with a healthy reset, not a crash | Confirms deeper momentum loss first |
| Macro Backdrop 2029 | Rate cuts and liquidity support risk assets | Tight monetary policy caps upside |
| Trendline Retest | The second bounce repeats 2023 pattern | The third touch breaks down, and the trend ends |
Five Catalysts That Could Drive Bitcoin Toward $300K
Beyond the chart itself, a handful of structural factors will likely decide whether this trendline bounce turns into a real cycle or fizzles out.
ETF adoption is still the biggest wildcard. The current outflow streak looks discouraging on paper, but the ETF infrastructure itself is only a couple of years old, and adoption tends to move in waves rather than a straight line.
More advisors adding BTC exposure to client portfolios over the next few years could easily flip these flows back to consistent green.
Sovereign reserves are the newer piece of the puzzle. A few nations have already started exploring or building Bitcoin reserves, and even small steps in that direction carry outsized signaling value.
If more governments follow, it changes the demand picture in a way retail buying never could.
Institutional accumulation tends to happen quietly, well before price reflects it. Outflow headlines grab attention, but longer-term holders and treasury-style buyers often add exposure during exactly these sideways, "boring" stretches, not during the euphoric highs.
The halving cycle still matters too. Supply issuance keeps shrinking with each halving, and historically the 12 to 18 months following a halving is when the bigger moves start to show up.
That timing lines up reasonably well with a 2028-2029 breakout window.
Macro liquidity ties it all together. Bitcoin has increasingly traded like a liquidity-sensitive asset, meaning looser monetary policy and more global cash sloshing around tend to lift it, while tightening does the opposite.
Keep an eye on rate decisions heading into 2028 and 2029; they could matter as much as the chart itself.
Methodology:
This forecast combines long-term trendline analysis, Bitcoin ETF flow data, historical halving cycles, macroeconomic trends, institutional adoption patterns, and momentum indicators such as RSI.
Bitcoin Price Prediction 2029: Expert View
Analysts watching the monthly chart point out that BTC sitting on the exact trendline that produced a 410% move is not something to ignore, even if the ETF data shows institutions pulling back for now.
A confirmed bounce off this level, paired with ETF flows turning positive again, would be the strongest signal that momentum is shifting back in Bitcoin's favor.
Until that happens, the setup remains a "watch and wait" story rather than a confirmed breakout.
Disclaimer: This article is written for educational and informational purposes only. Nothing here is financial advice. Cryptocurrency markets are volatile and unpredictable. All analysis is based on publicly visible chart data and historical patterns. Always do your own research before making any financial decisions.