XRP Price Prediction: After 30% Move, Is Altcoin Season Here
XRP Takes the Lead While the Crypto Market Pushes Up
The crypto market has started 2026 with a good volume. Bitcoin is up around 1%. Ethereum is slightly better, close to 1.35%. BNB and Solana are also trading higher, but overall, the market still feels cautious. Prices are moving up, yes, but nothing looks aggressive yet.
XRP is the odd one here. While most large coins are moving slowly, XRP has jumped nearly 11% and is trading around 2.37 dollars. Volume has also picked up fast, almost a 100% rise in a short period. That kind of activity usually shows a stronger interest, not just a random price move.
This is where the XRP price predictions start to feel a bit different. When the market is calm, and this one coin suddenly leads, it raises questions. Is XRP reacting to something specific, or is money slowly rotating back into altcoins? It may be early, but after this move, many are asking the same thing. Is this the start of something bigger for altcoins?
Let's discuss this in the article.
XRP Gains Attention After Ripple OCC Bank Application News
XRP is being talked about more after news came out that Ripple has filed an application with the OCC to become a National Trust Bank in the US. This is not normal crypto news. It shows Ripple is trying to move closer to the traditional financial system, not just stay on the blockchain side. That alone makes people pay attention.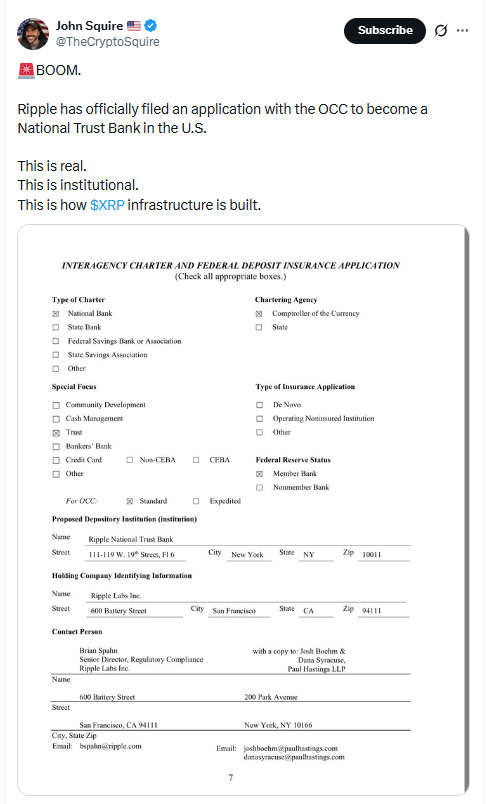
Source: X @TheCryptoSquire
This does not mean anything is approved yet. Filing an application and getting approval are two different things. The process can take time and may not even work out. Still, the sudden jump in volume shows the market is reacting to the altcoin news behind it. For now, it looks more like interest building than any final outcome.
XRP Price Breakout Signals Strength in the Short Term
XRP was stuck in a descending triangle for a long time on the 4-hour chart. Price kept pressing down but never really broke lower. On 2nd January, the price pushed out of that structure, and when it did, the move was fast. Price made three clear bottoms near the $1.80 level. That area kept holding again and again as an accumulation zone. Buyers were clearly active there and defending the support level; the rally did not come out of nowhere.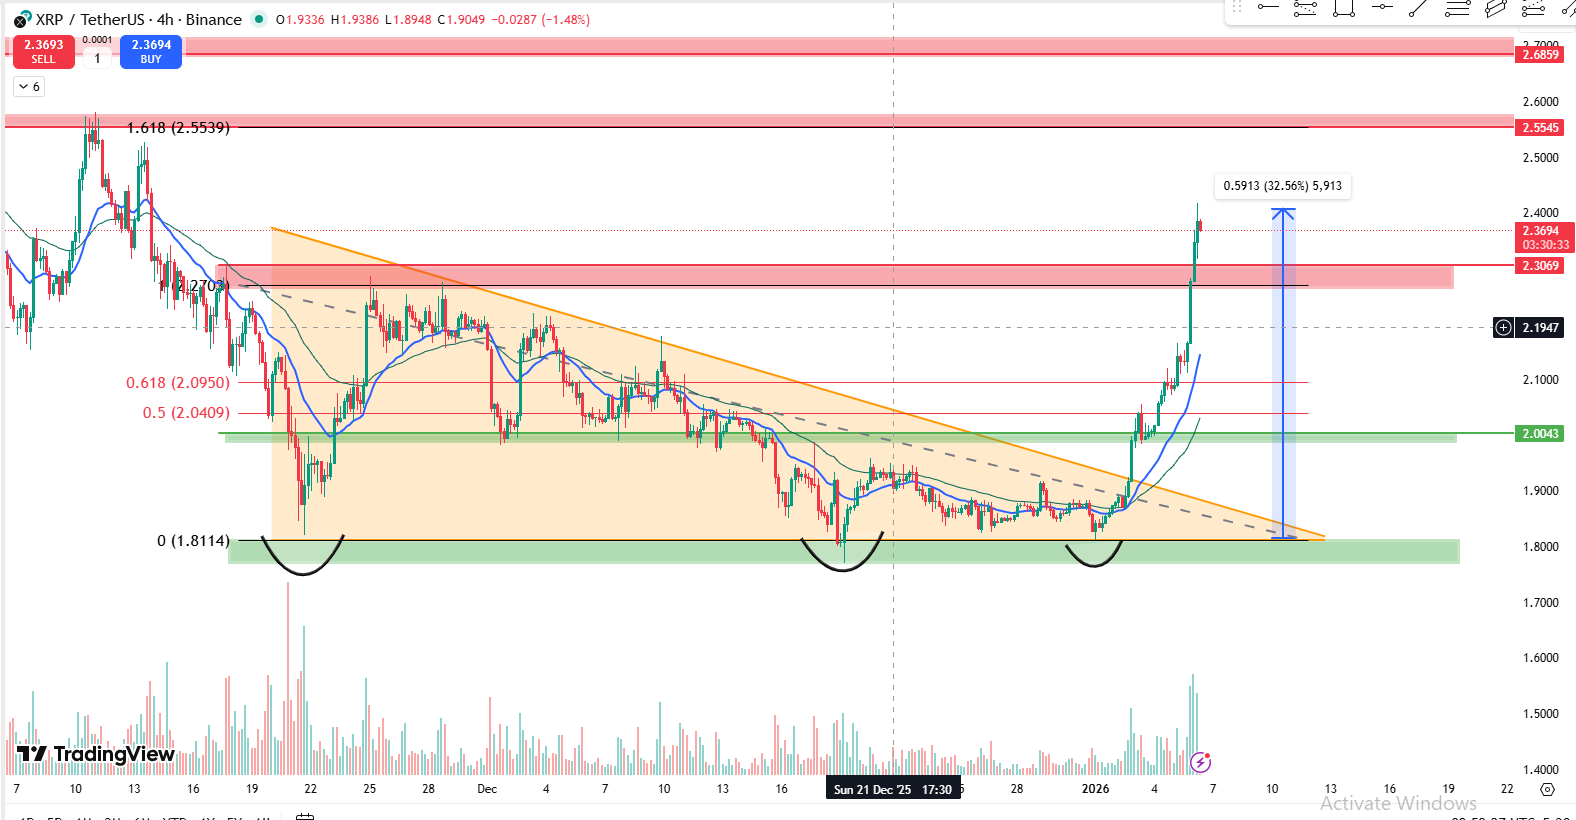
Source: TradingView
Also, the 21 EMA crossed above the 50 EMA. This golden crossover does not mean price will only go up, but it does show momentum has shifted. As long as the price stays above these averages, buyers have some control.
Now, after such a big move, a pullback is normal for the continuation of the trend. If price comes down, the $2.05 to $1.95 zone makes sense, because that is the 0.5 to 0.618 Fibonacci area. If the price holds there, the trend stays fine.
If the price moves up from here, $2.55 is the first area to watch, then around $2.70. But if this rally turns into a sell-off and does not hold on Fib levels and $2.00 breaks, the setup starts to fail, and the price can slide back toward $1.85 or even $1.80 again.
Analysts Share Long-Term Outlook on XRP Price Direction
This long-term chart shows coin price moving back above its previous all-time high trendline, with price now trading around the $2.30–$2.40 zone. In earlier cycles, reclaiming this level did not lead to small moves but opened the door for much larger expansions.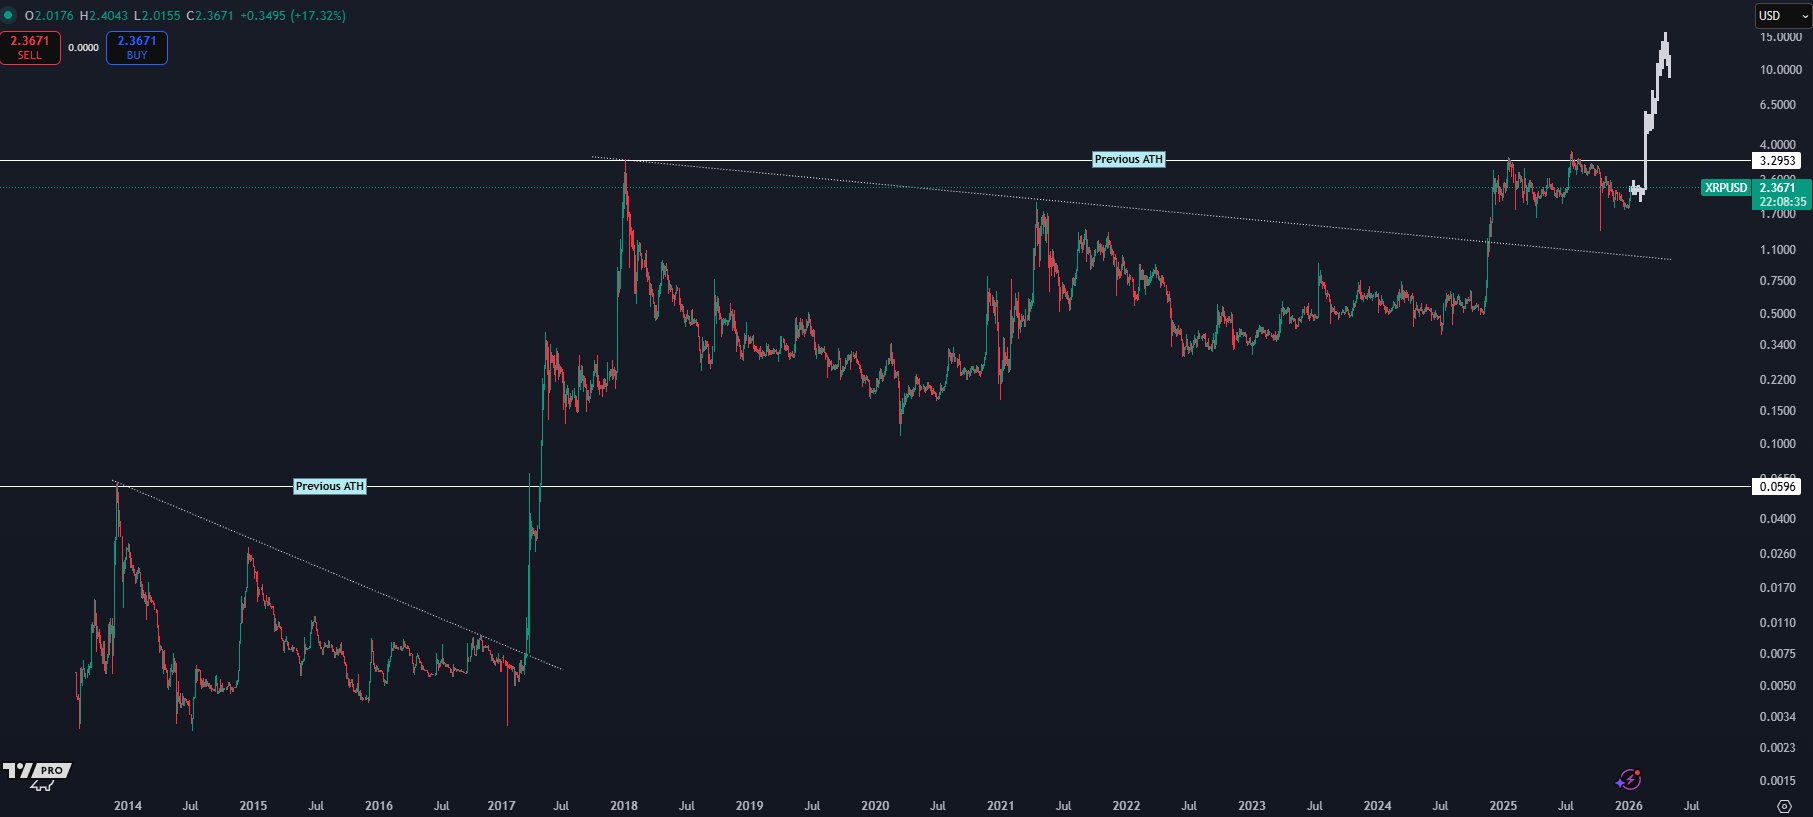
Source: X @CryptoKaleo
Because of this setup, some analysts believe XRP looks ready for price discovery. If price continues to hold above $2.00 and builds acceptance, upside targets around $4.00–$5.00 come into focus first, with extended moves toward the $7.00–$10.00 zone possible over the longer term. A drop back below $2.00 would delay this outlook.
Analyst Highlights Bullish Setup on XRP
Based on this 3-day chart setup, analysts are looking at higher price targets if the bullish momentum continues. If XRP holds above the recent breakout zone and MACD remains positive, upside levels around $3.00–$3.30 come into view first. A clean continuation beyond that could open the door toward the $4.00 area, which aligns with previous resistance and measured move projections.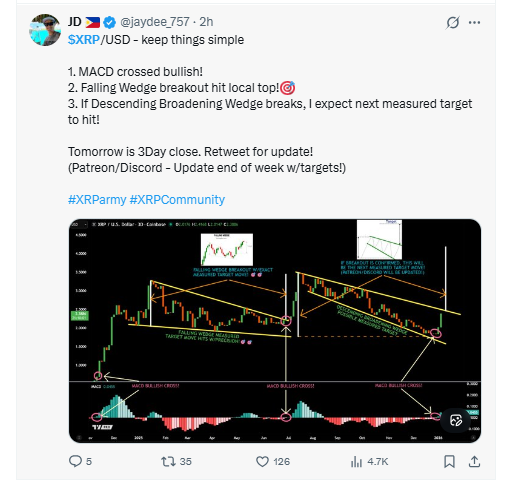
Source: @jaydee_757
On the risk side, this setup depends heavily on follow-through. In any case, if the price fails to hold above key breakout levels and momentum fades, the rally could come to an unexpected halt. A drop back below the recent structure would invalidate the bullish thesis and could cause the price to return to earlier consolidation zones before making another attempt higher.
Historical Cycles Point Toward a Potential Expansion Phase
This chart compares the current altcoin price structure with earlier market cycles, especially January 2017, which marked a local bottom before Ripple entered its strongest rally ever. The idea here is not about exact price repetition but about timing and structure. Back then, Ripple spent a long period moving sideways before expanding aggressively.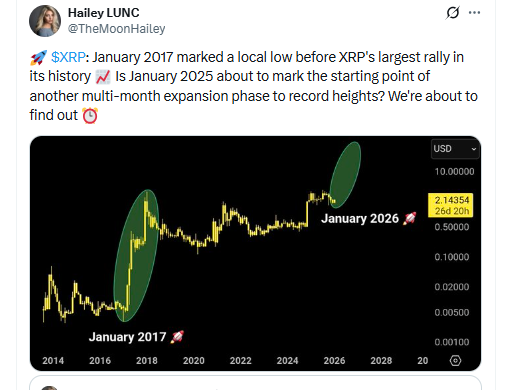
Source: X@TheMoonHailey
A similar pattern now appears to be forming around January 2025–2026, where price is stabilizing after a long consolidation phase. Analysts looking at this chart believe the coin price may be entering another multi-month expansion phase rather than a short-term spike.
Conclusion
Taken together, the long-term structure and improving momentum are starting to matter more for this XRP price prediction. Price is not moving randomly here. Even if short-term pullbacks happen, that is normal at this stage and does not change the bigger picture unless key levels break. What stands out is how current price action lines up with past cycles and major technical zones. Nothing is guaranteed, but this mix of structure, momentum, and historical context is why many analysts think XRP could be setting up for a larger move, possibly even a phase where the price starts exploring new levels over the coming cycle.
YMYL Disclaimer
This content is for informational purposes only and does not constitute financial advice. Cryptocurrency investments involve risk, and readers should conduct their own research before making any investment decisions.


