Bitcoin Price Prediction: Will BTC Back to $100K or Crash to $32K

Is Bitcoin getting ready for another massive rally, or is it just going to go through a deeper correction like it did in the past? As BTC is being traded in a very narrow consolidation area, analysts are getting more and more divided in their opinions about the future.
Using past cycles, technical indicators, and recent on-chain developments, this Bitcoin Price Prediction will determine if BTC is going to increase in price or if it is going to go through a significant downside movement.
Bitcoin Price Prediction Based on 2021 vs 2025 Market Structure
The popular crypto analyst Ali Charts is of the opinion that the present price structure of Bitcoin is very much like that of the 2021 cycle. In the comparison he provided, the 2021 chart indicates BTC had a peak of about $69,000, followed by a sharp correction. The 2025 chart, however, is drawing the same kind of setup after peak around $104,000-$105,000.
The main resemblance is in the steep rise, taking profits, and early signs of selling. This analogy indicates that the current price situation bears great resemblance to the preceding cycle, and that is why BTC may be entering a difficult corrective period just like it did during the last cycle.

Bearish Long-Term Outlook: Is BTC Months Away From a Market Bottom?
Ali Charts also mentions the possibility of a bear market in the long-term view regarding the asset supported by looking at the quarterly BTC chart that shows historical market cycles. It is the interpretation of the analysis that Bitcoin is about to complete (288) days before its next macro bottom. Said so, the downside target is near the level of $37,500.
On average, it has gone through a series of long declines, then the cycle low formation and the beginning of an upward trend for the cycle. If this tendency continues, the next major bottom might be in October 2026, which would be in line with the typical four-year market cycle behavior.

Analysts Warn of a Deeper Crash Toward $32,000
Contrary to the bullish sentiment, analyst Chiefy hints at the possibility of Bitcoin going down to $32,000 within a few weeks if the selling pressure becomes stronger. The argument that BTC has not finished its correction yet is made by the repeated fractal patterns from 2021 and the quarterly cycle structure.

This raises an important question for investors: Will Bitcoin repeat history once again?
Institutional Accumulation Offers Mixed Signals
Even though the technical outlook is quite negative, the developments in the institutions’ activities give a much more complicated picture. Michael Saylor has reported that his company has increased its USD reserves by $748 million and is now holding a total of $2.19 billion along with 671,268 BTC, thus confirming its long-term commitment to Bitcoin.

At the same time, Arkham Intelligence has disclosed that Trump Media has purchased 451 BTC, which brings its total possession to 11,542 coins. These occurrences are a clear sign that while the market is still unstable in the short term, the long-term investors are still patiently waiting to accumulate more when the prices are lower.

Consolidation Zone: What Do Technical Indicators Say?
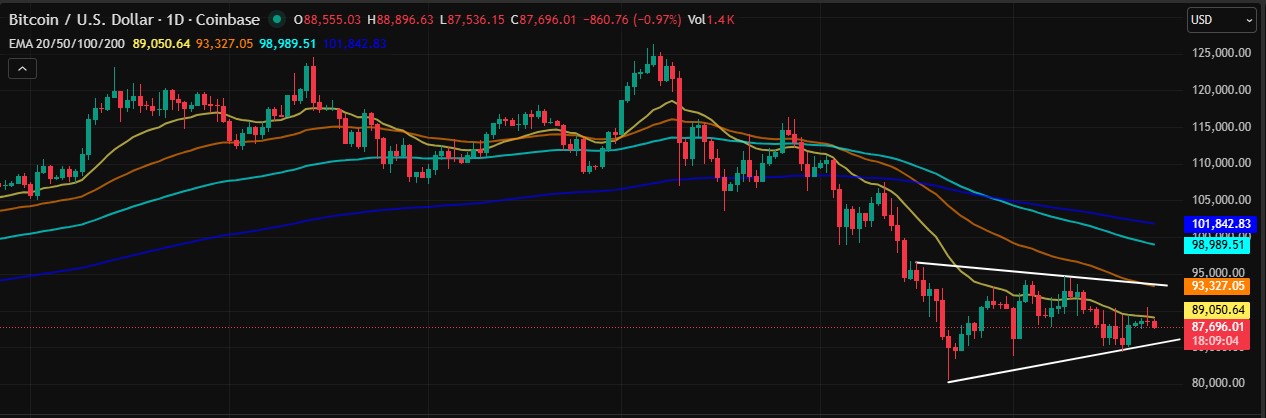
On the technical side, the coin is very much in a no-trading situation, as pointed out by analyst TED. It has been consolidating in the range of $85,000 to $90,000. The price recently tried to close above the $90,000 level but did not succeed, and at the time of writing, already fallen back to $87,700.
Bitcoin has a position below its 20, 50, 100, and 200-day moving averages, which is indicative of short-term selling pressure. In the meantime, the RSI is still under 50 and is flat, which means that the strength of momentum is weak and traders are undecided.
BTC Price Prediction: Key Levels to Watch
The world's largest cryptocurrency is currently at a significant level where the direction of the price will depend on the next daily closing.
Bullish Scenario:
A daily closing above $90,000 would probably bring back the bullish momentum, therefore, leading BTC to $95,000 and maybe the psychological $100,000 level.
Bearish Scenario:
A confirmed closing below $85,000 could cause selling pressure, thus pulling Bitcoin down to $75,000–$70,000. In case the market remains weak, the deeper downside targets near $37,500 or $32,000 would still be a possibility.
Thus, will Bitcoin go against history—or repeat it once again? The upcoming few weeks can set the direction for the whole market cycle.
Disclaimer
Crypto price predictions are for informational purposes only and not financial advice. The crypto market is highly volatile, and prices can change at any time. Do your own research before investing. We are not responsible for any financial losses.


