Bitcoin Price Prediction: Will BTC Hold $65,000 Support?

Bitcoin Slips to $66,900: Why is BTC Price Falling Today?
Is the ambitious Bitcoin Price Prediction facing a reality check?
The king of crypto is slipping.
Bitcoin has dropped 1.94% in the last 24 hours and is now trading near $66,811. This is not just a random move. The total crypto market cap is also down more than 2%, showing that the weakness is spread across the market.
The reason looks clear.
The Federal Reserve is turning hawkish again.
Officials are signaling that interest rates may stay higher for longer. When money becomes expensive, big investors reduce exposure to volatile assets like BTC.That pressure is now visible on the charts.
Now the $65,000 support level is now the key zone. If buyers defend it, the Bitcoin Price Prediction story stays intact.
If not, the market could test lower levels before finding stability.
Traders are watching this level very closely.
BlackRock Sells 85M USD BTC: What It Means
According to data shared by Mr Whale on X, BlackRock has sold 85.16 million USD worth of BTC.
The amount is not massive compared to total Bitcoin market liquidity. But the timing is important. Bitcoin is already trading close to a key support zone.
When a large institution reduces exposure, short term sentiment usually turns cautious. Traders start watching support levels more closely.
US Spot Bitcoin ETFs See Continued Outflows
Recent ETF data from SoSoValue shows that US-listed spot Bitcoin ETFs are seeing steady outflows.
Weekly net inflows have turned negative. Some weeks are showing outflows above 300 million dollars.
In late January, the numbers were even larger, crossing 1 billion USD in net withdrawals.
This matters because ETF flows reflect institutional demand.
When ETFs see consistent outflows, it usually means large investors are reducing exposure. That can weaken short term momentum in BTC.
With BTC already trading near key demand level, continued ETF selling could increase pressure unless fresh buying demand returns.
Why Bitcoin Is Down Today: Technical Outlook
According to analysis shared by DonWedge on X, BTC has broken down from its previous triangle formation on the 2-hour chart.
Price is now moving inside a descending channel, forming lower highs and lower lows. This keeps short term pressure on buyers.
Key support is near $65,000. If that level fails, downside volatility may increase.
At the same time, descending channels sometimes turn into bullish reversal setups. A breakout above channel resistance could quickly change momentum.
For now, market structure remains fragile, and traders are watching support closely.
Why BTC Is Down Today: 4H Technical Outlook
On the 4-hour TradingView chart, price had formed a bearish flag pattern after the sharp fall from higher levels.
That structure has now broken to the downside.
This breakdown shows sellers are still active on rallies. The recovery attempt failed, and price slipped again inside the lower range.
RSI on the 4-hour timeframe is near 40. This shows momentum is weak but not fully oversold yet. It means sellers still have some control, though extreme panic is not visible right now.
If price continues to trade below the broken flag structure, downside pressure can remain in the short term.
Key Support Levels
$65,000 (immediate support zone)
Key Resistance Levels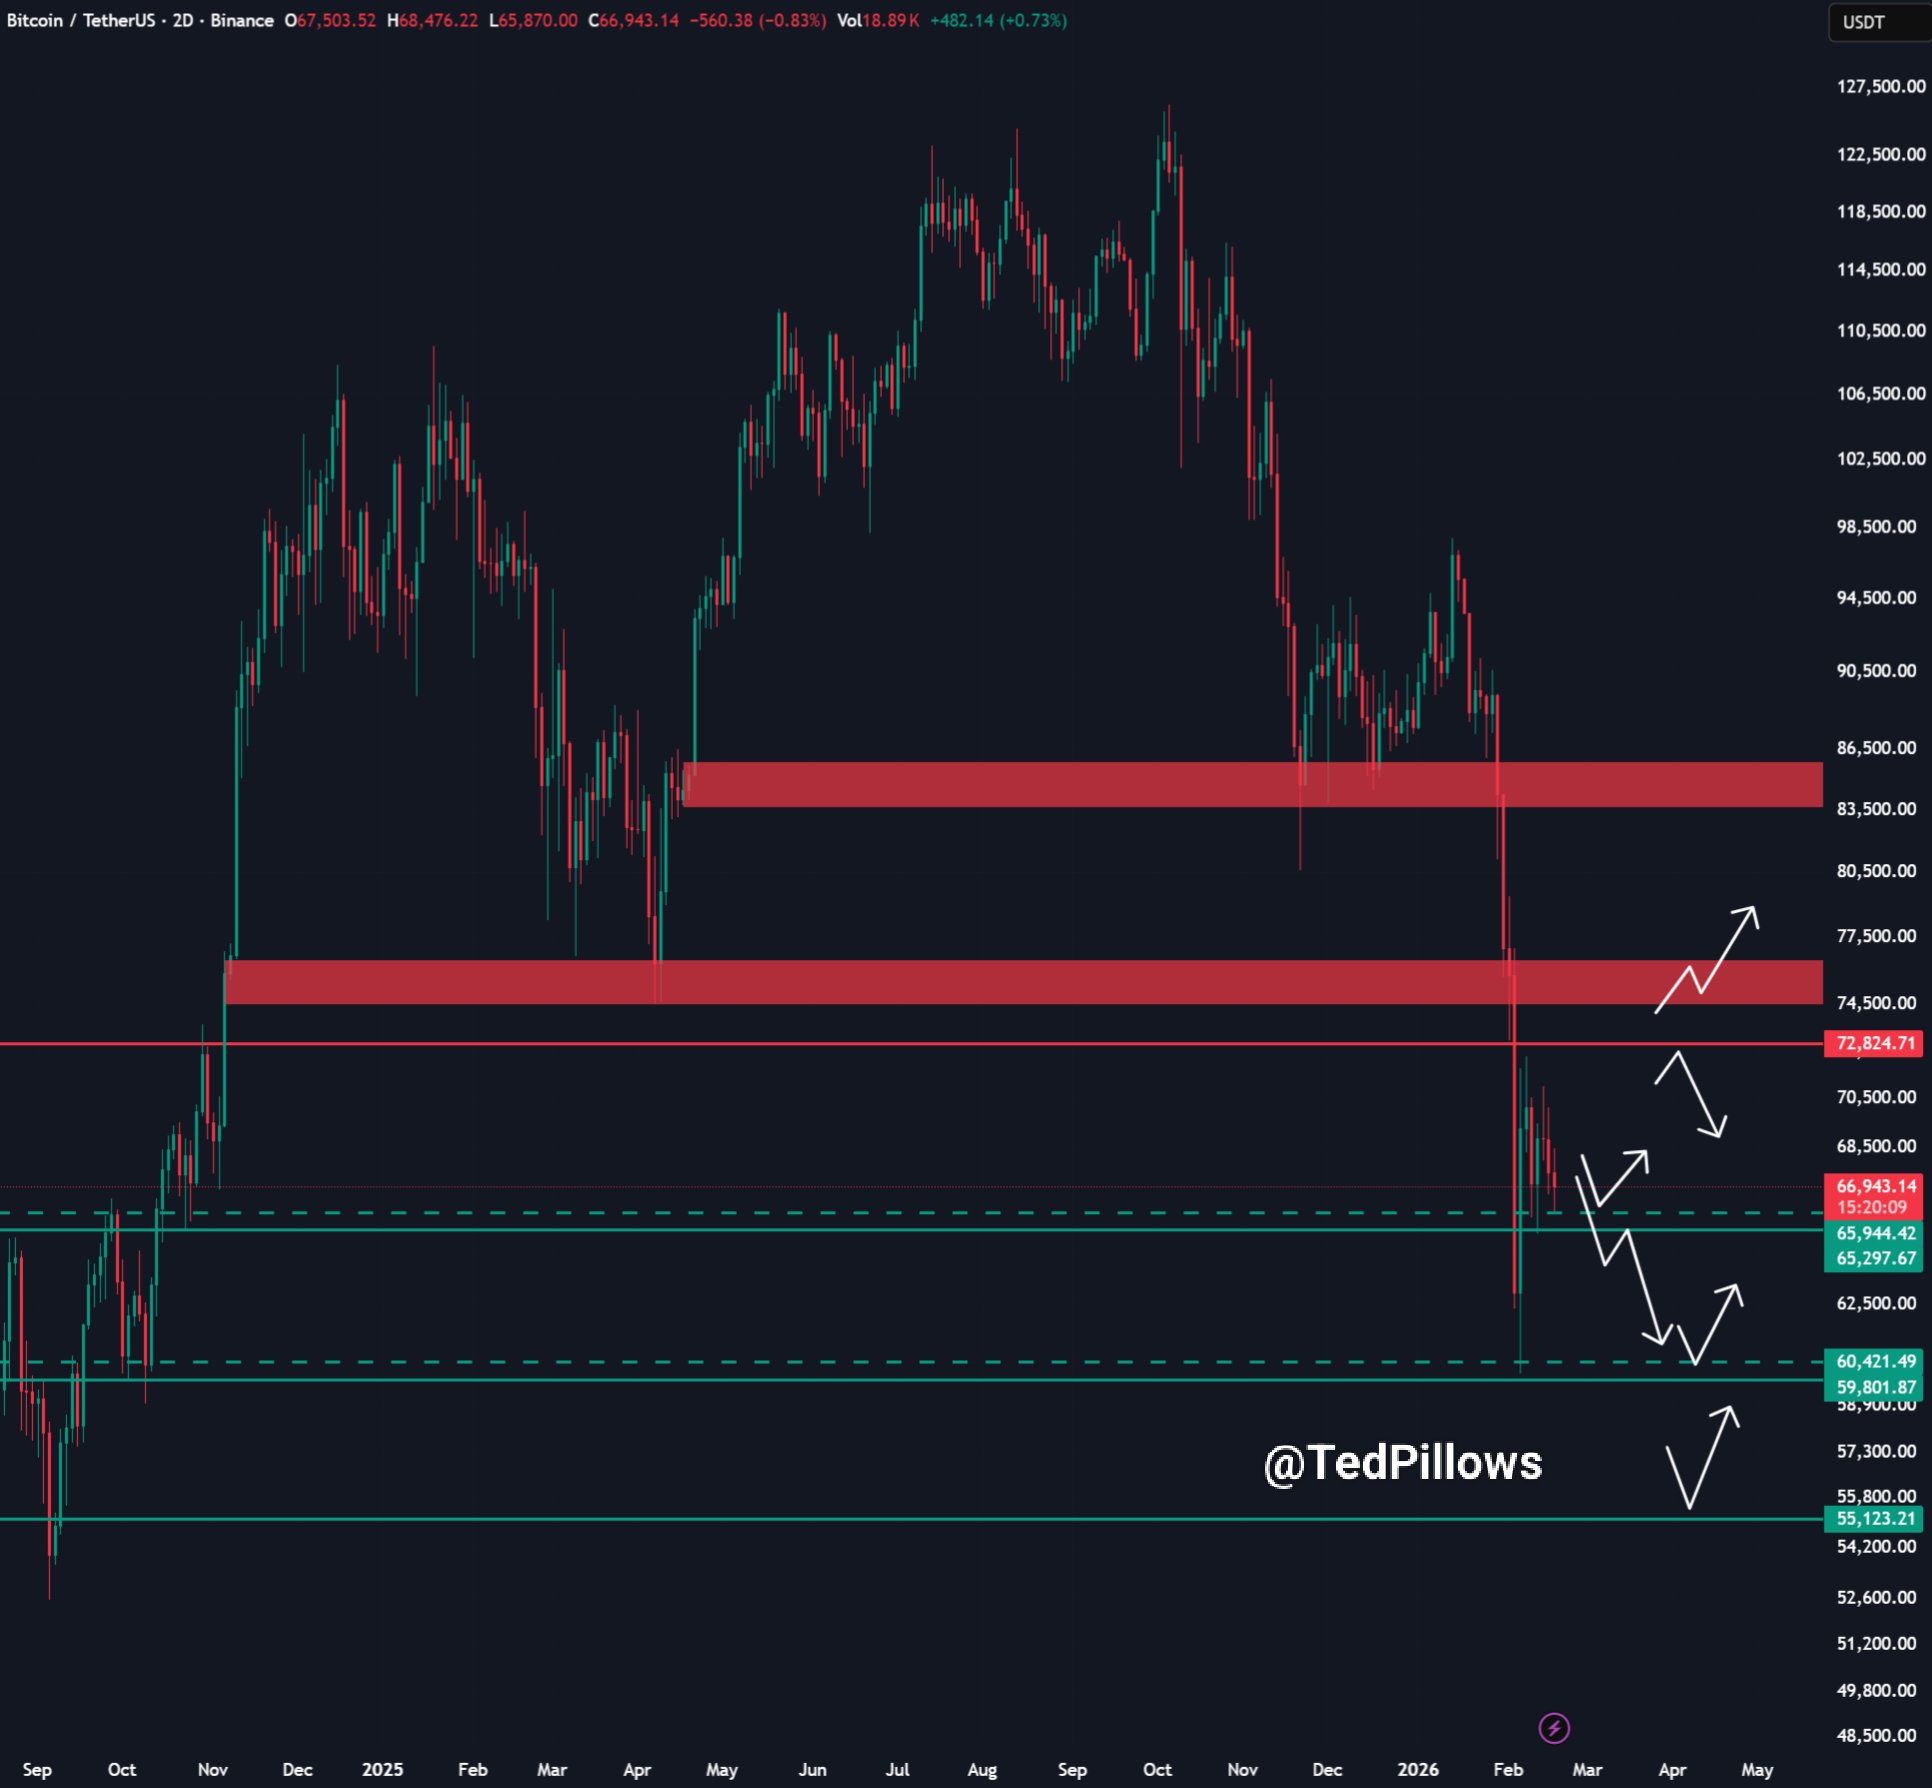
$70,000 (short term resistance)
$74,500 (strong resistance level)
$80,700 (higher supply zone)
For now, structure remains cautious on the 4H timeframe. Buyers need to reclaim 70,000 USD to shift short term momentum.
What Analysts Say As Bitcoin Falls Below $67,000
According to analysis shared by Ted Pillows on X, BTC is looking weak on the 2-day timeframe.
Price has dropped below the $67,000 level, which was acting as short term structure support. This breakdown increases pressure on buyers.
The next crucial zone sits between $65,000 and $66,000. This area is important because it holds the higher low structure on the 2D chart.
If price fails to hold this range, the market could see a deeper move toward the $60,000 -$55000zone. That level has strong historical demand and liquidity.
For now, the reaction around $65K will decide whether BTC stabilizes or extends the downside.
Expert View
The current Bitcoin Price Prediction outlook depends heavily on the 65,000 USD support zone.
Macro pressure, ETF outflows, and recent technical breakdowns are weakening short term momentum. Lower timeframes are already showing bearish structure.
If 65,000 USD holds, BTC can attempt a recovery toward 70,000 USD.
If this level breaks, the Bitcoin Price Prediction scenario may shift toward a deeper move near 60,000 USD and possibly 55,000 USD.
Right now, everything depends on how price reacts around support.
YMYL Disclaimer: This article is strictly informational in nature and does not constitute an investment recommendation. Investment in cryptocurrencies is extremely volatile, and market conditions can change quickly based on macro data. It is always essential to do your own research before making any investment.