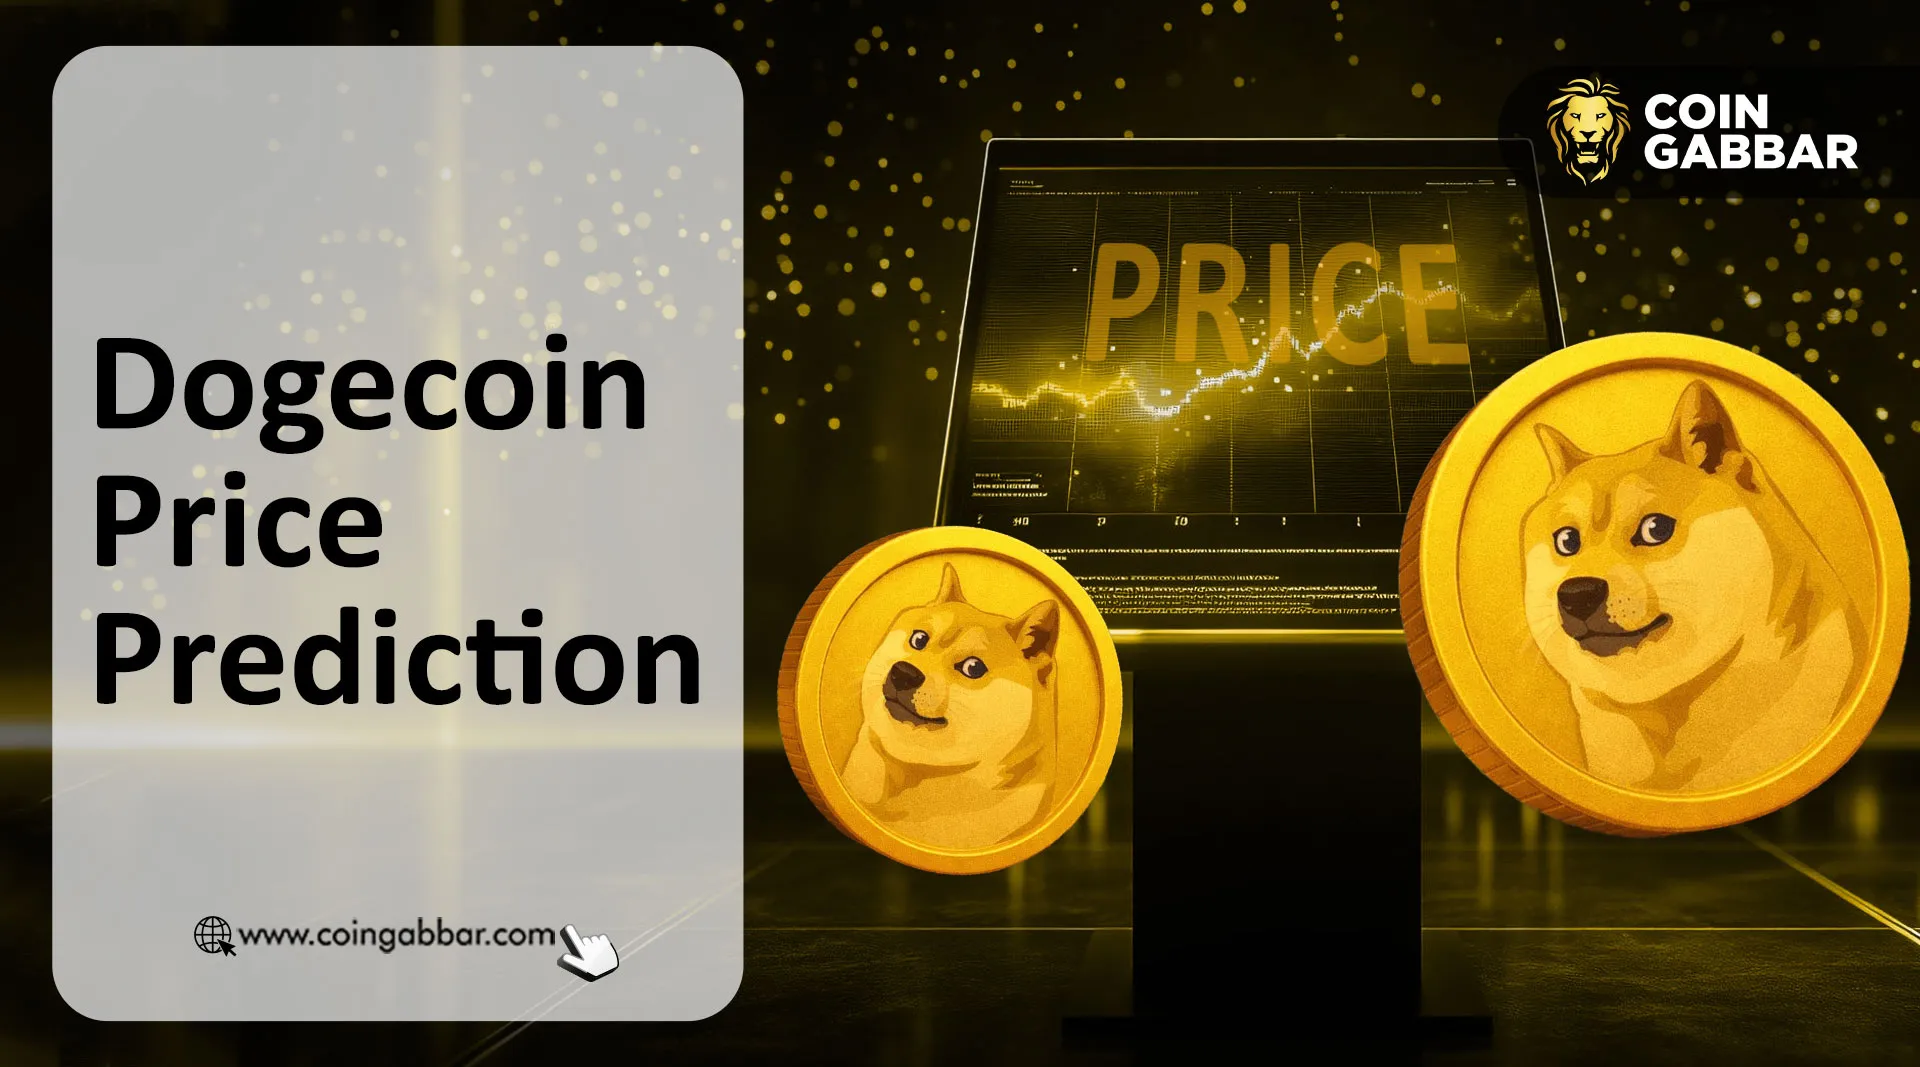
Dogecoin Price Prediction 2026: Why Analysts Now Eye a Move to $2
Dogecoin Market Feels Quiet as Structure Builds
Dogecoin Price Prediction 2026 is slowly shifting tone.
This no longer feels like random price noise.
Do traders still remember how quiet Dogecoin looked before the early 2021 rally?
While traders react to small dips, the monthly chart is staying quiet.
So the real question is simple: is the market missing what the structure is building?
As of now, Dogecoin is holding near the $0.12 demand zone, volume is thin, and sentiment feels bored. Price is compressing, not collapsing.
This phase does not look exciting, yet it looks like positioning before attention returns.
Dogecoin Price Action Shows Demand Holding Under Pressure
On the 4-hour chart, price action is simple. price is leaning on a rising trendline that has already acted as support before.
The last reaction from this level triggered a strong rally, which is why traders are still watching it closely.
Price is back near the $0.12500 area, pressing into the same support. The structure is holding for now. A bounce keeps the short-term bias intact, while a clean break below this trendline would shift attention lower.
Key Levels to Watch
Price is sitting at a decision point, with structure still intact but little room for noise.
Support zone: $0.12500
Rising trendline support where price is currently reacting.Downside risk: $0.11800 – $0.11500
Loss of the trendline opens this lower demand area.Immediate resistance: $0.13500
A push above this level would be the first sign that buyers are stepping back in.Upside continuation: $0.15000 – $0.15600
Acceptance above this range shifts momentum back toward the bulls.
The move from here does not need speed; it needs direction. Price holding above support keeps the upside path open. A clean loss of it tilts the bias lower.
Dogecoin Daily Setup Remains Range Bound
CoinGape Media recently highlighted this structure, noting how price continues to respect its broader daily range. The chart is staying controlled, not reactive.
On the daily chart, DOGE remains inside a descending channel. Price reacted from the $0.11500–$0.11800 demand zone, but momentum is still muted.Supply pressure is visibly higher, extending toward the $0.18000–$0.20000 zone, which remains the coin's broader upside target on the daily structure.
A sustained break below the $0.11500 demand zone would invalidate this setup and shift the daily bias lower. Until then, the move looks more like digestion than a trend shift.
Dogecoin 3-Day Structure Shows a Familiar Setup
As highlighted by Alan Tat, DOGE is moving through a familiar higher-timeframe structure. Similar phases in the past have not been about immediate price moves but about resetting before a broader cycle expansion.
The current setup on higher timeframes reflects compression rather than weakness, a behavior that has historically played out over longer market windows instead of short-term reactions.
Dogecoin Weekly Structure Continues to Hold
As highlighted by Ali Martinez, this memecoin is moving through a familiar phase on the weekly chart. After sharp expansions in the past, price has often spent long periods compressing inside falling structures.
This phase looks similar. Instead of breaking down, volatility is shrinking, and price is holding its base near the $0.12–$0.13 zone, which continues to act as weekly support.
On the upside, resistance begins around $0.18, followed by higher zones near $0.29, $0.55, and the psychological $1.10 level, all of which capped price during previous cycles.
On the weekly timeframe, this behavior usually reflects digestion rather than weakness, a setup that often goes unnoticed while it is forming.
Dogecoin's Monthly Price Action Keeps the Bigger Setup Intact
As highlighted by Alan Tat, the monthly chart of Dogecoin continues to respect a rising long-term trendline that has held through multiple cycles.
Every major expansion in the past began after price compressed along this structure.
The current pullback is sitting on the same slope, holding above the $0.10–$0.12 support zone, which has repeatedly acted as a base. 
As long as this area remains intact, the broader structure stays supported.
On the upside, the monthly chart still shows clear resistance levels near $0.29, followed by higher historical zones around $0.55 and the psychological $1.10 level.
This timeframe does not reflect distribution. It reflects repetition within a long-term cycle.
Dogecoin Price Prediction 2026 to 2030
Across higher timeframes and analyst observations, DOGE's long-term direction now ties closely to cycle expansion rather than short-term moves.
2026: If the structure continues to hold, Dogecoin could work its way toward the $0.25–$0.45 zone, driven more by base expansion than momentum.
2027: With sustained participation, price may extend into the $0.45–$0.75 range, reflecting a continuation phase rather than a breakout cycle.
2028: This phase likely brings a test of the previous cycle high, placing Dogecoin around the $0.75–$1.10 zone if broader market conditions stay supportive.
2029: Acceptance above earlier highs could open room for price discovery, pushing DOGE into the $1.10–$1.50 range as the cycle matures.
2030: In a full extension scenario, longer-term projections start to stretch toward the $1.50–$2.00 zone, driven by cycle expansion rather than short-term speculation.
Invalidation: A sustained loss of the $0.10 monthly support would weaken this entire outlook and shift Dogecoin back into prolonged consolidation.
Conclusion
Dogecoin Price Prediction 2026 remains more about structure than speculation. Across higher timeframes, Dogecoin is compressing rather than breaking down, a pattern often seen before larger cycle moves.
So, is a move toward $2 possible? The charts do not guarantee it, but they show a clear path. If previous highs are reclaimed during the next expansion phase, higher psychological levels come into focus. Until then, patience matters more than predictions.
YMYL Disclaimer: This article is for informational purposes only and does not constitute financial advice. Crypto investments carry high market risk. Always do your own research or consult a professional advisor before investing.