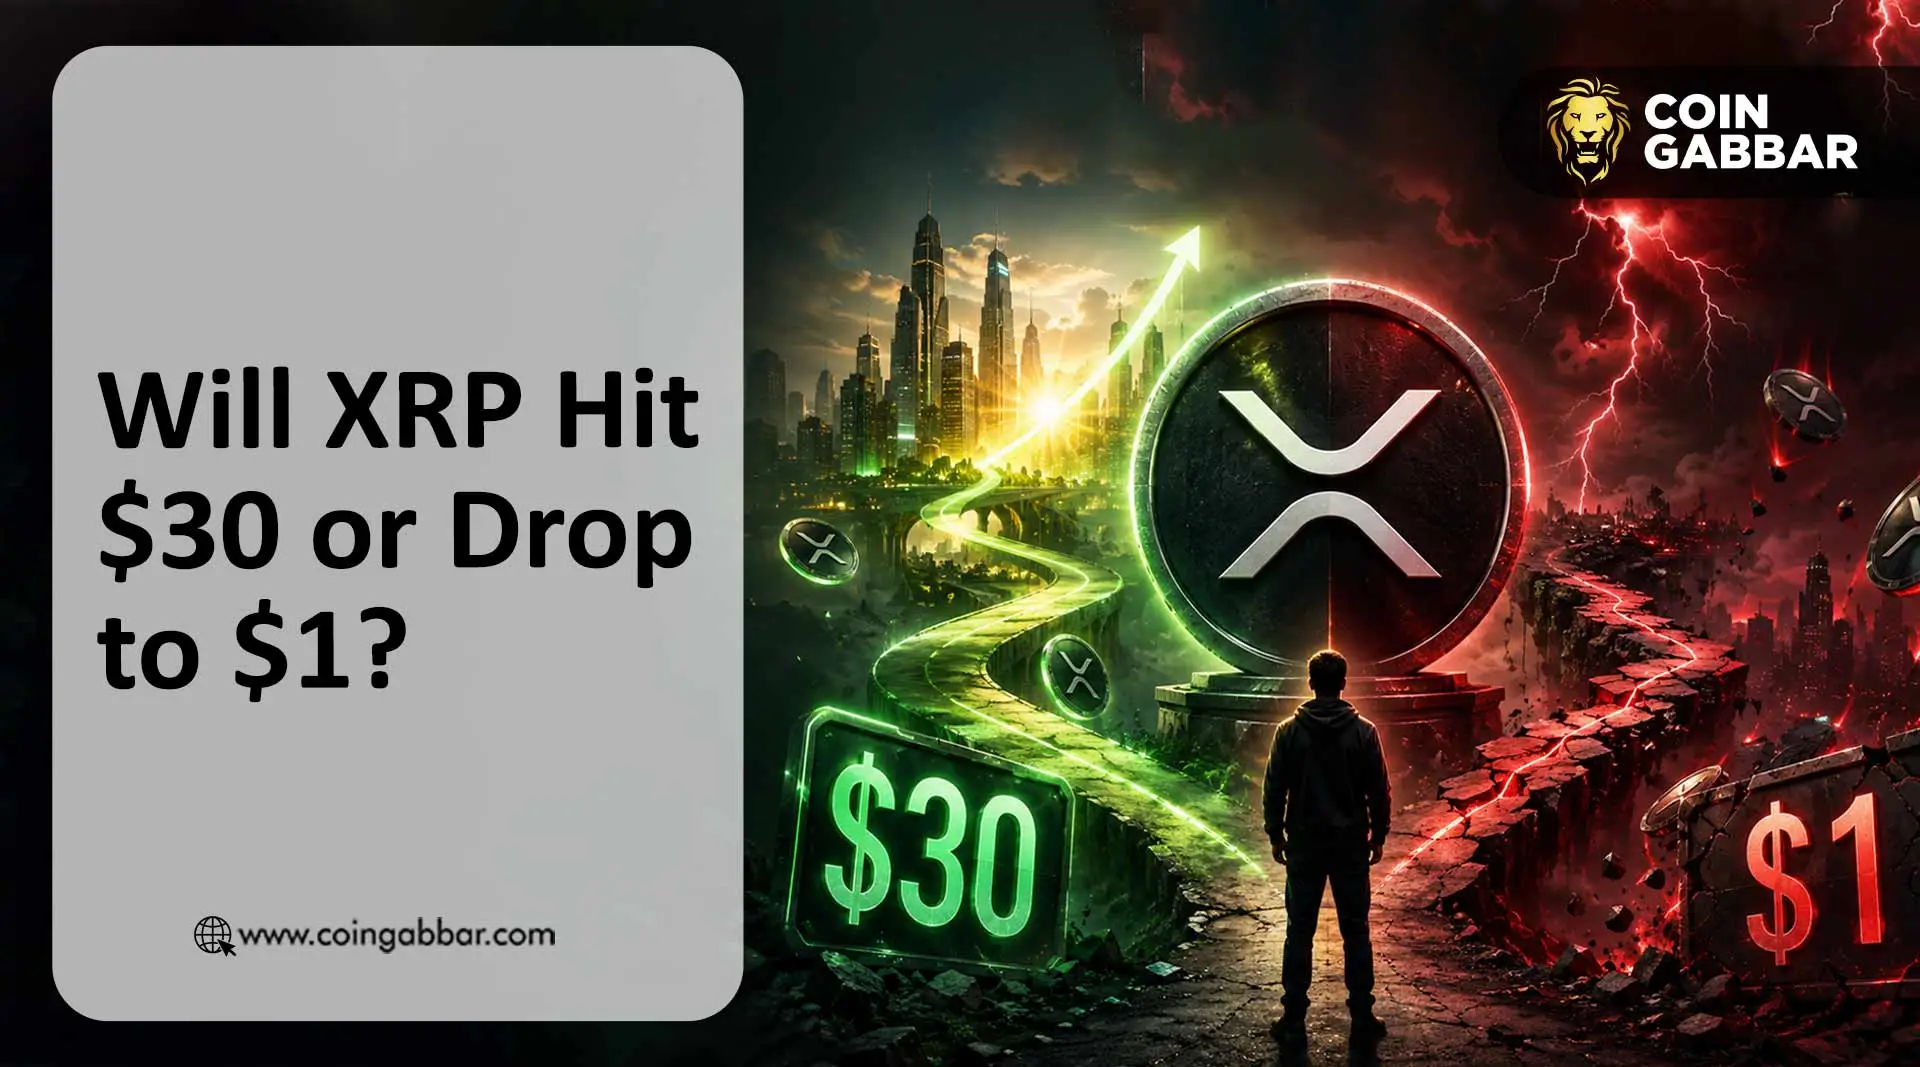
XRP Price Prediction 2026: Will It Break $1.50 or Fall to $1?
XRP is at a crossroads right now. Not the kind of traders talk about every week. The real kind, where the next candle close decides the next three months.
The token is sitting at $1.38, down 0.40% in the last 24 hours, with trading volume around $2.02 billion.
Five straight sessions of losses across Bitcoin, XRP, Ethereum, and Dogecoin have the market feeling heavy.
But if you dig into the chart right now, something unusual is building quietly.
XRP Price Today: What Is Actually Happening
The altcoin hit $3.65 back in July 2025 after Ripple won its legal battle with the SEC. Since then, it has lost roughly 62% of its value and is now trading at $1.38 with a circulating supply of 61.82 billion tokens.
Most recent buyers are sitting at a loss. The short-term sentiment is bearish. But the technical picture tells a more complicated story, and that is exactly what makes this moment worth paying attention to.
Bollinger Band Squeeze: What Does It Mean for Price?
As per crypto analyst Ali, the 3-day chart is showing its tightest Bollinger Band squeeze in over a year. That is not a minor detail.
When Bollinger Bands compress this tightly, it means volatility has almost completely dried up. Price gets coiled like a spring. And when that spring finally releases, the move is almost always sharp and quick.
The bands do not tell you up or down. They tell you something big is about to happen.
Right now, experienced traders are staying flat. No long, no short. Just watching.
What Are the Key XRP Price Levels to Watch Right Now?
Three numbers matter more than anything else this week.
$1.50 is the line bulls need to break. A clean 3-day candle close above it opens the path to $1.80, and then the $2.00 to $2.20 zone after that.
Every rally in March, April, and May has stalled at $1.50. Breaking it with a confirmed close changes everything.
$1.35 is the immediate danger zone on the 4-hour chart. Losing this level with volume accelerates the selling pressure fast.
$1.29 is the floor that matters most. A 3-day close below $1.29 breaks the bullish structure completely and puts the $1.00 psychological support back on the table.
XRP ETF Inflows 2026: Are Institutions Actually Buying?
Here is what the bearish crowd keeps missing. While spot price drifts lower, institutions are quietly loading up.
XRP ETF inflows just hit their highest weekly level of 2026. In the latest session alone, ETF investors bought $750,440 worth of tokens, pushing total ETF-held net assets to $1.14 billion.
Cumulative inflows since the ETF launch in late 2025 now stand at $1.32 billion. The week of April 28 brought in $119.6 million, which was 53% of all global crypto fund inflows that week.
Smart money does not panic at $1.38. When price drops and ETF buying increases at the same time, that is called accumulation. It does not guarantee a rally. But it does tell you that the people with the most information are not selling.
CLARITY Act 2026: Does It Change the Price Target?
The CLARITY Act is the regulatory event with the most direct impact on price this year.
The bill already passed through the Senate Banking Committee, which gave a brief push toward $1.50.
If it reaches the President's desk before July 4, the timeline that analysts are watching closely, it removes the last major legal overhang that has kept large institutions cautious about allocating serious capital to XRP.
Standard Chartered estimates that CLARITY Act passage could unlock $4 to $8 billion in additional ETF inflows. That kind of demand hitting a market with 61 billion tokens in circulation would create real upward pressure on price.
XRP NEWS: Analysts are increasingly comparing XRP’s current setup to previous cycle breakouts that led to explosive multi-month rallies.
Can XRP Reach $30? The Bitcoin $1.4 Million Theory Explained
This is the prediction turning heads in the crypto community right now, and it deserves a clear explanation rather than dismissal.
One well-followed market analyst, Jav0n Marks, has laid out a full Bitcoin cycle roadmap. Bitcoin trades around $126,000 by the end of July 2026, hits resistance, and moves sideways through October.
Then, in November 2026, it enters a parabolic phase and peaks near $1.4 million by March 2027. After that peak, overflow capital rotates aggressively into altcoins, and XRP becomes one of the primary beneficiaries.
As per crypto bulls, the $30 XRP target comes from that altcoin overflow scenario. A move from $1.38 to $30 is roughly a 2,075% gain. That sounds extreme until you look at history.
The altcoin has previously delivered rallies of 1,100%, 1,600%, and far larger from momentum setups similar to the Bollinger Band compression it is sitting in right now.
This is not a trade for next month. This is a cycle thesis built around a multi-phase Bitcoin roadmap, with altcoin seasons expected in August through October 2026 and again after Bitcoin peaks.
The same analyst also warns clearly that a prolonged bear market follows the Bitcoin top, which means timing matters enormously.
Is $30 guaranteed? Nothing in crypto ever is. But when Bollinger Bands are at a one-year squeeze, ETF inflows are hitting yearly highs, the CLARITY Act is close to passing, and the macro cycle structure is historically bullish, the case for XRP making a serious run over the next 12 to 18 months is not as far-fetched as the current $1.38 price makes it seem.
This article is published for informational purposes only and does not constitute financial, investment, tax, or legal advice. Cryptocurrency markets are highly volatile and carry significant risk, including total loss of capital. Always conduct independent research and consult a qualified financial advisor before making any investment decision.