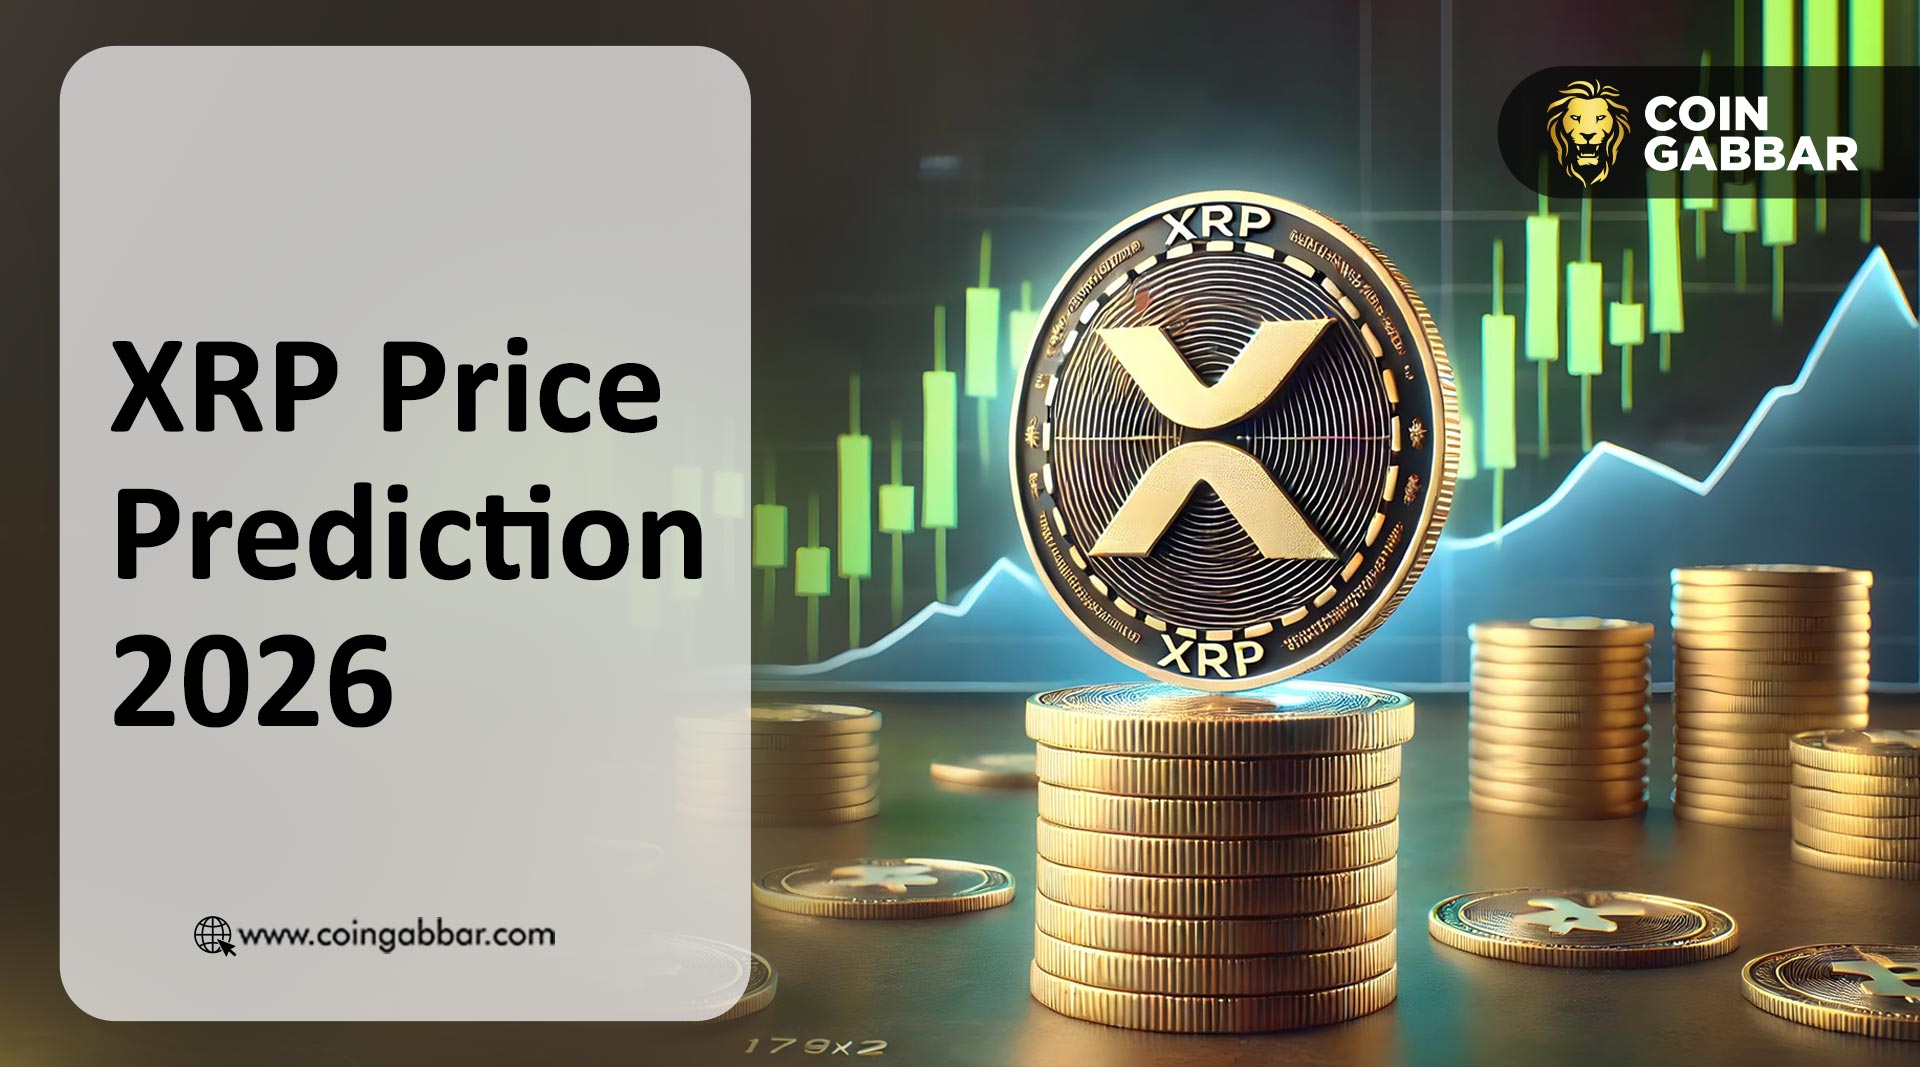
XRP Price Prediction 2026: Is This the Setup for Major Breakout?
XRP Market Outlook: Decoding the Gap Between Utility and Price
On January 13, 2026, the XRP Ledger quietly printed a six-month high of 1.45 million daily transactions.
It did not move the price or sentiment, but it did create a gap that markets rarely ignore for long.
While attention stays fixed on the daily moves around $1.90, XRP Price Prediction 2026 is drawing interest for a different reason.
Network activity is expanding, yet price remains compressed, a setup traders have seen before in assets like Ethereum during long accumulation phases. This kind of divergence does not ask for attention; it waits.
As of Friday, January 23, price is hovering near the $1.87 support zone. Price feels heavy, confidence looks thin, and patience is wearing down for many retail traders.
So the real question lines up with the bigger picture:
Is this the setup for a major breakout the market has been waiting for?
XRP ETF Activity Signals Quiet Institutional Interest
A recent tweet shared by Xaif Crypto on X adds another layer to this divergence. XRP ETFs recently closed with $17.57 million in daily volume, even as the price stayed range-bound. This kind of flow often appears quietly, before sentiment catches up.
When volume builds without price expansion, it usually hints at positioning rather than speculation.
XRP Short-Term Price Structure on the 4-Hour Chart
Coin is moving inside a descending channel on the TradingView 4-hour chart. Price is holding near the $1.87 support area and has been reacting around the middle of the channel rather than breaking down. Each pullback is getting absorbed, keeping the market setup intact for now.
Key Levels
Support: $1.87–$1.81
Resistance: $2.05–$2.20
Potential Move: $2.40–$2.55 if structure holds
Invalidation: A sustained move below $1.80 changes the short-term bias
XRP Daily Chart Shows Tightening Structure
On the daily chart, price action is trading between two key forces. From the top, a long-term descending trendline continues to cap price.
From below, an inverted head and shoulders pattern is developing near the $1.87–$1.91 zone, showing gradual buyer interest.
According to crypto market analyst CryptoWZRD, price has printed an indecisive daily close and is now testing the $1.91–$1.92 support area. This zone is acting as a short-term decision point.
A bullish reaction could open room for an upside move, while failure to hold may keep price stuck in sideways consolidation rather than a clean breakdown.
Key Levels
Support: $1.91–$1.87
Neckline area: $2.20–$2.30
Upper resistance: $2.55–$2.75
Invalidation: Sustained acceptance below $1.80 weakens the setup
XRP Two-Week Chart Hints at a Bigger Structure
On the 2-week chart, This coin is shaping a large cup and handle pattern that has been building quietly over multiple years.
As per the chart shared by technical expert DrBullZeus, this pattern has the potential to turn XRP into one of the biggest altcoin plays when the cycle fully opens up.
The rounded base shows long-term accumulation, while the current handle phase reflects consolidation below resistance rather than rejection. As long as price holds above the $1.80–$1.90 region, the setup remains intact.
Key Levels to Watch
Handle support: $1.80–$1.90
Breakout zone: $2.20–$2.40
Major resistance: $3.30–$3.50 (ATH area)
Pattern target (cycle view): $5.00
This setup is not about short-term speed it is about structure. If price clears the upper resistance band with volume, the cup and handle projection toward the $5 zone starts to come into focus rather than sounding speculative.
XRP Fractal Structure Points to a Much Bigger Cycle
Multi-year structure highlighted by Steph Is Crypto on X points out that XRP’s current structure closely resembles its 2017 consolidation phase. At that time, price remained compressed longer than expected before expanding sharply.
In the near-to-mid cycle view, this structure first opens room toward the $5–$10 zone, which aligns with previous resistance and pattern extensions. Beyond that, the comparison shifts to the bigger picture.
If the broader cycle and fractal continue to develop, some long-term projections linked to this setup stretch much higher, with upper extensions reaching toward the $75 zone over time.
This framing is less about timing and more about understanding how scale can change once structure resolves.
XRP 2026 to 2030 Price Prediction
Year | Expected Price | Market View |
2026 | $3.50 – $5.00 | Breakout phase if structure holds |
2027 | $5.00 – $10.00 | Cycle continuation, momentum-driven |
2028–2029 | $10.00 – $25.00 | Broader adoption + market cycle |
2030+ | Up to $75 (cycle extreme) | Long-term fractal extension |
Invalidation: A sustained break and acceptance below the $1.80 support zone would weaken the broader bullish structure and delay the projected cycle expansion.
Expert View
For XRP Price Prediction 2026, analysts are paying more attention to structure than short-term price moves. Network activity, ETF participation, and higher-timeframe patterns are all pointing in the same direction, even while price remains compressed. This phase looks less like weakness and more like positioning. As long as the $1.80 support zone holds, experts see the broader setup for this coin staying intact rather than breaking down.
YMYL Disclaimer: This article is for informational purposes only and does not constitute financial advice. Crypto investments carry high market risk. Always do your own research or consult a professional advisor before investing.