AI Companions Price Prediction 2026–2030: Can AIC Hold the Rally?


AI Companions Price Prediction: Current AIC Market Snapshot
AIC trades near $0.0391 as of 23 September 2026, 15:20 UTC, after a sharp 24-hour move. This AIC price prediction starts right here, and it ties into broader crypto price prediction coverage across the wider market. Momentum built fast this week.
Turns out, the move added roughly 50% in a single day, per CoinMarketCap data. Market cap sits near $29.29 million against a fully diluted value of $39.06 million.
Volume over 24 hours reached $272.27K, a thin figure next to the market cap. Circulating supply stands at 749.99 million AIC out of a 1 billion max supply. Holders number roughly 26,220 wallets.
Metric | AIC Snapshot |
Current Price | $0.0391 |
24H Change | +50.74% |
Trend | Bullish |
Next Target | $0.0727 |
Support | $0.0071–$0.0078 |
Resistance | $0.0727 |
RSI | 61.89 |
Bull Case | Break above $0.0727 |
Base Case | Range $0.030–$0.060 |
Bear Case | Fail below $0.030 |
Invalidation | $0.030 |
AIC Price Prediction for the Short Term
AIC Price Outlook for the Next 24 Hours
Immediate support sits near $0.033, just under the current trading zone. Resistance holds around $0.0405, the intraday high recorded at 15:17 UTC. Momentum leans bullish. But volume has cooled since the initial spike.
RSI near 62 leaves room to run before overbought territory returns.
AIC Price Prediction for the Next 3–7 Days
A range between $0.030 and $0.055 looks likely over the coming week. Breakout confirmation needs trading to hold above $0.0405 on rising volume. A breakdown below $0.030 would open a retest of the old consolidation shelf.
Confirmation matters more than any single trade.
AI Companions Technical Analysis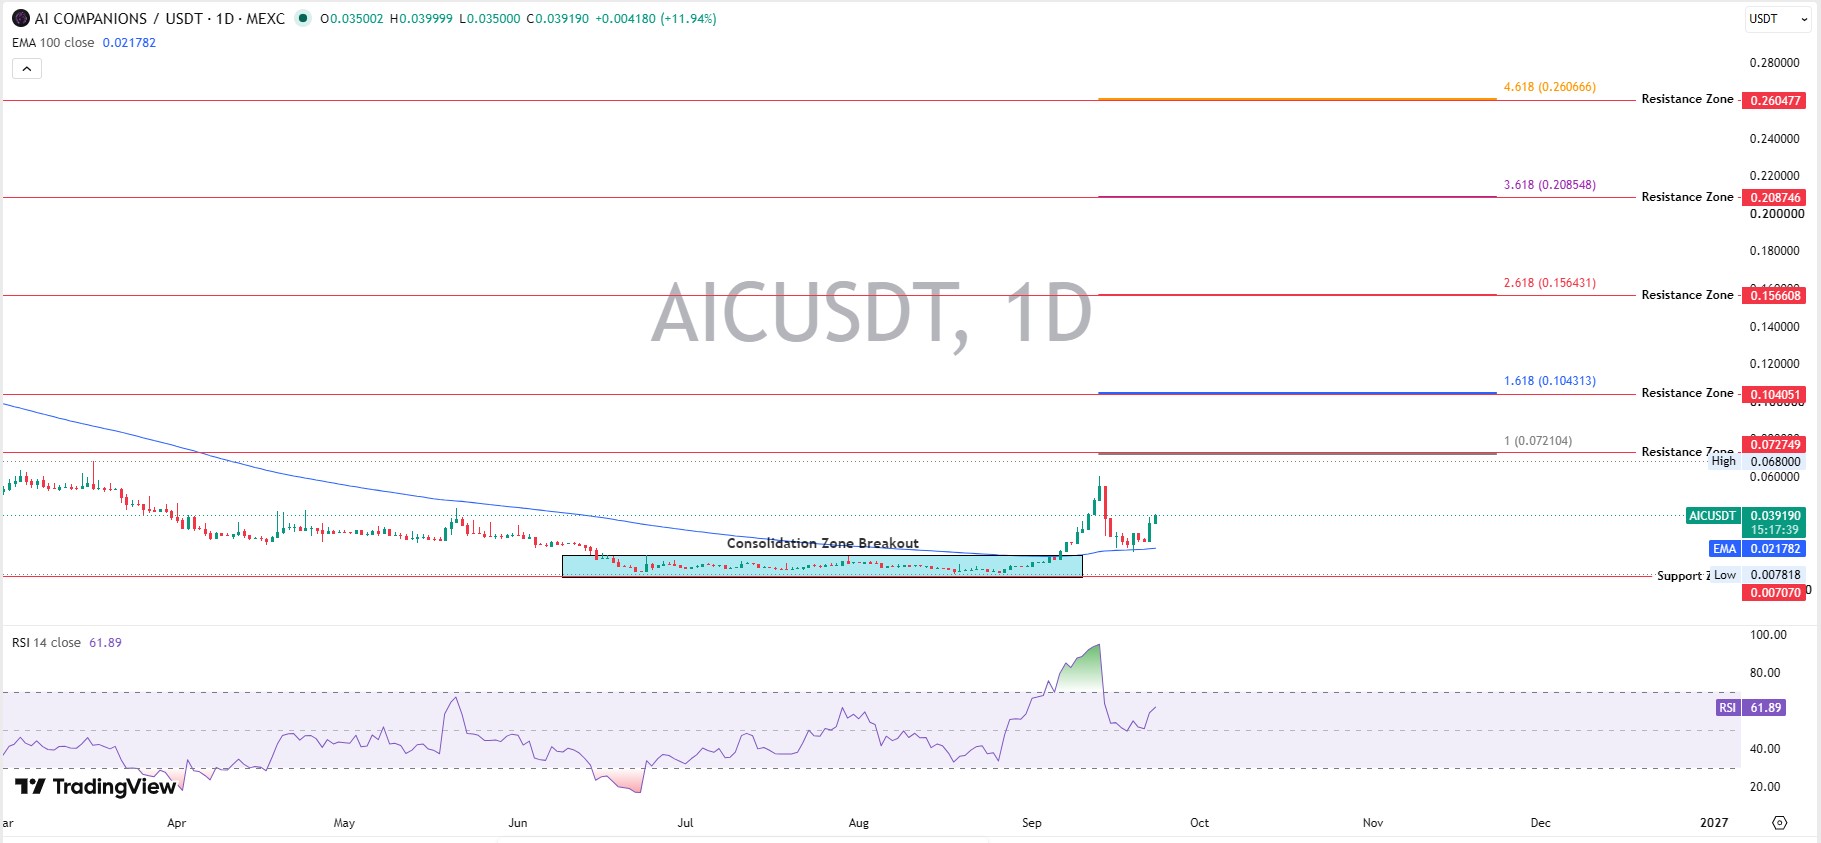
AIC Support and Resistance Levels
Fibonacci extensions drawn from the daily chart, viewable on TradingView, place resistance zones at $0.0727, $0.1041, $0.1566, $0.2087, and $0.2605. Support holds in the $0.0071 to $0.0078 zone, the old consolidation floor from March through August.
That's a wide gap to the first major resistance. Room to climb. Room to fall, too.
AIC RSI and Momentum
RSI 14 reads 61.89 on the daily chart, based on the latest TradingView reading. It spiked near 80 in early September, a classic overbought signal, then cooled off through the pullback.
Cooling RSI after a spike usually points to consolidation, not reversal. Exhaustion risk stays real, though, if trading pushes back toward 80 without pausing first.
AIC Volume and Trend Analysis
Trading sits above the 100-day EMA of $0.0218, which confirms an uptrend on the daily chart. And yet volume has faded since the breakout surge, dropping roughly 27% in the most recent 24-hour window per CoinMarketCap.
A rally without volume behind it tends to stall. That's the risk here.
AIC Breakout and Breakdown Levels
A breakout above $0.0727 with rising volume would open a run toward $0.104. A breakdown below $0.030 would send trading back into the consolidation shelf near $0.018 to $0.020.
Watch volume on either move. It decides which scenario plays out next.
AI Companions Price Prediction 2026
Scenario | 2026 Range | Conditions |
Bear | $0.018–$0.028 | Support fails, momentum weakens |
Base | $0.030–$0.060 | Consolidation with gradual recovery |
Bull | $0.075–$0.130 | Resistance breaks with volume |
Consolidation defined most of 2026 until September. And that breakout changed the entire conversation around this token.
AI Companions Price Prediction 2027–2030
Year | Bear Case | Base Case | Bull Case | Main Driver |
2027 | $0.020–$0.040 | $0.060–$0.120 | $0.150–$0.250 | Adoption and liquidity |
2028 | $0.030–$0.060 | $0.100–$0.200 | $0.250–$0.450 | Ecosystem growth |
2029 | $0.040–$0.080 | $0.150–$0.300 | $0.400–$0.650 | Market cycle |
2030 | $0.050–$0.100 | $0.200–$0.400 | $0.550–$0.900 | Adoption plus market cap |
Market cap reasoning drives these ranges more than raw percentage math. With a supply near 1 billion tokens, even a modest rise in valuation moves the price meaningfully. CoinMarketCap currently shows roughly 750 million AIC circulating against that 1 billion ceiling, and that ratio matters for any long-range AI Companions price prediction.
What Could Drive the AIC Price?
AI and Virtual Companion Adoption
Real user adoption of the underlying companion product remains the core driver here. Weekly feature drops, branded Companion Clips, kept the community engaged through September.
AIC Ecosystem Development
Product launch timing matters most. A live release, paired with exchange listing news, could shift sentiment fast in either direction.
Token Utility and Supply
A six-figure buyback and burn campaign runs through the end of October, according to a post from AI Companions on X. Reduced float could support price if demand holds steady.
Whale and Large-Holder Activity
Holder concentration runs high on this token. The top 100 wallets hold 98.42% of supply, and eleven whale wallets alone control 62.80% of market cap, based on BscScan data.
That's concentrated. One large sell decision could move this token fast.
Bitcoin and Broader Market Direction
AIC still trades inside the wider crypto cycle. A Bitcoin drawdown tends to drag smaller memecoin and altcoin tokens down with it, regardless of individual project news.
AI Companions Price Risks
Extreme volatility already defines this token. A 50% daily move proves that much. Liquidity stays thin relative to market cap, with a volume-to-market-cap ratio under 1%.
Concentration risk runs severe, given the whale holdings noted above. Broader crypto selloffs could hit AIC harder than most due to its small size. Product execution risk stays open until launch actually happens.
Supply changes from the burn campaign could cut either way. Resistance rejection near $0.0727 would stall the rally fast. Support failure below $0.030 would confirm a deeper pullback.
AIC Bull, Base, and Bear Scenarios
Bull case: Trading clears $0.0727 with rising volume. Confirmation holds across two sessions. The price zone extends from $0.104 to $0.156. Invalidation sits below $0.055.
Base case: Trading ranges between $0.030 and $0.060 into year-end. Confirmation comes from sideways volume without a clean breakout. Invalidation is a decisive move past either edge.
Bear case: Trading fails to hold $0.030. Confirmation comes on rising sell volume. The price zone drops toward $0.018 to $0.022. Invalidation sits above $0.040.
Is this rally built to last, or just another spike before a fade?
That question sits at the center of every AIC chart discussion this week. Fine.
What Traders Should Watch Next
AIC trading relative to the $0.0727 resistance zone
Daily volume trend, not just price alone
RSI behavior near overbought territory
Bitcoin's broader direction
Whale wallet movement, trackable on BscScan
Support retention above $0.030
Product launch and AI-linked crypto news
Upcoming listings on the coin events calendar
When trading data was pulled for this piece, the first thing that stood out was how fast RSI cooled after touching 80. That kind of reset often buys a token more room to climb. It does not guarantee it.
Disclaimer
This content covers technical analysis and market data for informational purposes only. It's not financial advice. Cryptocurrency trading carries high risk, including total loss of capital. Independent research and consultation with a licensed financial advisor are recommended before making any investment decision.


















