Bitcoin Price Prediction 2027: Will BTC Hit a New All-Time High?


Bitcoin Price Prediction 2027 New All time high
Bitcoin Price Prediction is at one of those moments right now where the chart is screaming louder than any headline. After printing a double top near $75,000 earlier in 2026 and breaking down through the neckline, BTC has been grinding lower — forming what looks like a series of lower lows and lower highs on the weekly timeframe. BTC is trading at $60,312, with the weekly candle showing a swing between $58,030 and $65,597.
But here's what makes this interesting. If you've been watching BTC long enough, this pattern feels very familiar.
Where BTC Actually Stands Today — June 27, 2026
Before we get into the chart, let's take a quick look at the numbers
BTC Market Snapshot
| Metric | Value |
| Current Price | $60,312.01 |
| 24h Change | +0.59% |
| Market Capitalization | $1.2 Trillion |
| 24-Hour Trading Volume | $35.96 Billion |
| Circulating Supply | 20.04 Million BTC |
| Maximum Supply | 21 Million BTC |
| FDV | $1.26 Trillion |
A $1.2 trillion market cap says a lot. No other asset in the crypto space has ever come close to this level — not even during the most euphoric bull runs. Bitcoin isn't just leading the market right now, it's doing what it's always done, quietly absorbing every bearish narrative thrown at it and still standing.
What really stands out, though, is the supply side of things. Out of a hard cap of 21 million BTC, 20.04 million have been mined. That leaves less than 960,000 Bitcoin left to ever enter circulation — ever. Add the 2024 halving on top of that, which cuts the daily new supply in half, and you've got an asset where the available supply is shrinking at the exact same time institutional demand through ETFs is growing.
Historically, reduced supply combined with growing institutional participation has supported bullish sentiment, although market conditions can change over time. With roughly 20.04 million BTC already in circulation out of a hard cap of 21 million, the scarcity argument isn't going away.
Bitcoin ETF Data — What Institutions Are Doing Right Now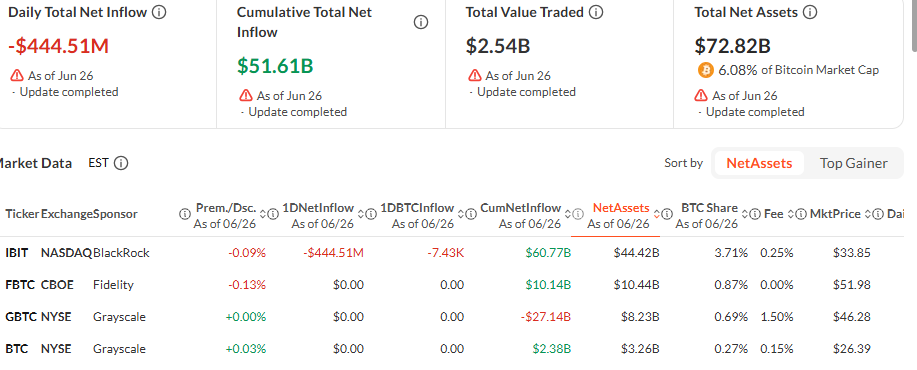
One thing that's completely different about this cycle compared to 2020–2021 is the Bitcoin spot ETF market. These funds didn't exist back then. Now they're managing $72.82 billion in total net assets — that's 6.08% of Bitcoin's entire market cap sitting in regulated products.
ETF Data Point
Value (As of Jun 26, 2026)
Yesterday Net Outflow
-$444.51 Million
Cumulative Net Inflow
$51.61 Billion
Total Value Traded
$2.54 Billion
Total Net Assets
$72.82 Billion
The daily outflow of -$444.51 million on June 26 is worth noting — it's coming almost entirely from BlackRock's IBIT. Short-term, this kind of ETF outflow can create selling pressure and explain some of the recent weakness. But zooming out, the cumulative inflow of $51.61 billion shows institutions haven't left the game — they're just being patient.
BTC Technical Analysis 2027 — What Does The Chart Say?
Here's where things get genuinely interesting
Go back to late 2022 and early 2023. Bitcoin was doing something very specific on the weekly chart — it was forming lower lows, lower highs, a classic bearish structure. Every bounce got sold. People were calling for $10,000.
What Happened in the 2024 Halving Cycle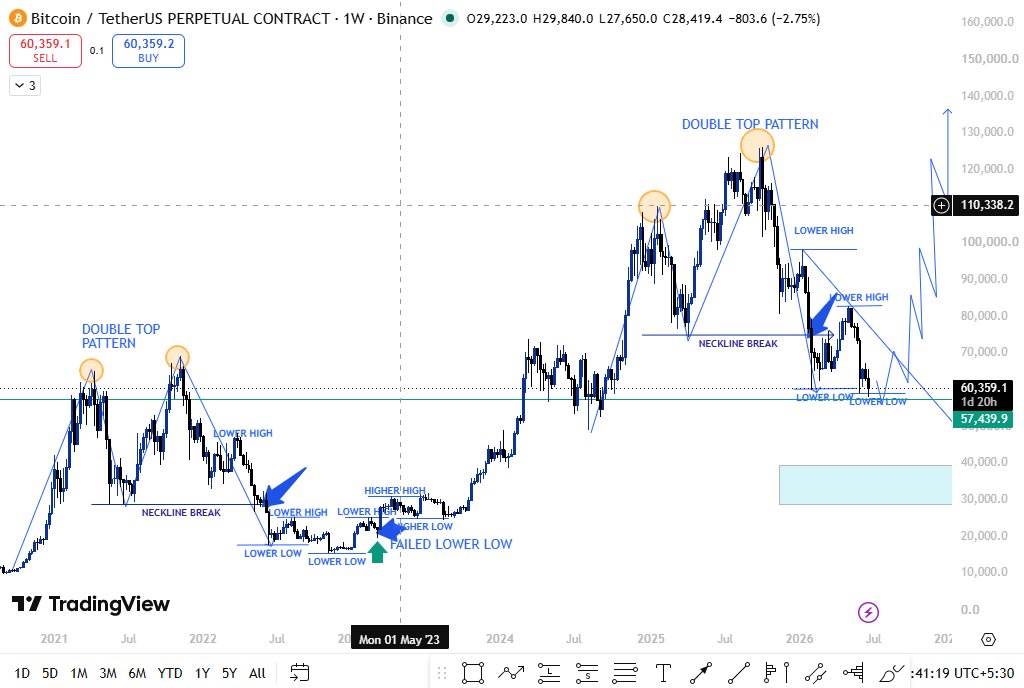
The macro was terrible. Then something happened. The lower low failed to print. Instead of making a fresh low, Bitcoin started printing a higher low. That shift — from lower low to higher low — was the exact moment the structure flipped. What followed was a near-vertical move that eventually broke the previous all-time high and pushed all the way to $109,750 in 2025.
The failed low wasn't a headline. It wasn't on the news. But on the weekly chart, it was everything.
What's Happening Right Now in 2026 — Same Setup, New Cycle
Fast forward to today, and BTC is doing something remarkably similar.
After the double top pattern formed around $75,000 and Bitcoin broke its neckline to the downside, the weekly chart has been printing a familiar sequence — lower high, lower low, lower high, lower low. Classic breakdown structure.
Current weekly candle range: $58,030 to $65,597, closing around $60,373.
But look at that $57,500 zone. That level has been tested twice on the weekly timeframe and held both times. It's also sitting right on a long-term rising trendline that Bitcoin has respected since the 2022 bear market lows. Two clean touches, no close below.
The setup being tracked right now is this:
If BTC fails to make a new lower low and holds above $57,500, the structure starts shifting
A higher low forms — same signal we saw in 2023
The weekly trendline holds for the third time
After that trendline breakout, the path opens toward $100,000 first, then a push toward $130,000–$150,000 for the new all-time high
This is not a prediction based on hope. It's a pattern repeat that Bitcoin has demonstrated before, and the structure is lining up again.
Historical Precedent — What Happened 12 Years Ago
It's also worth remembering that Bitcoin's history is full of these whipsaw moments that shake out weak hands before the real move begins.
As per a crypto analyst , twelve years ago, Bitcoin crashed 50% in just 6 hours — dropping to $120 — before eventually pumping to $1,175. The chart looked catastrophic at the moment. Anyone who zoomed out and stayed patient saw something completely different.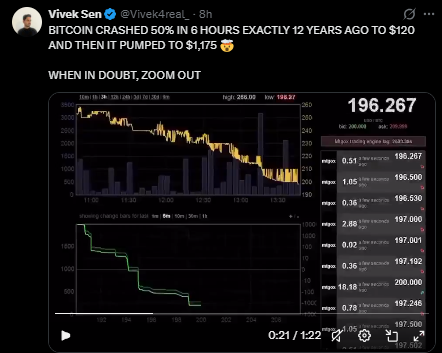
The lesson then and now: when in doubt, zoom out.
Bitcoin Price Prediction 2027 — Key Levels to Watch
Support Zones (Weekly Chart)
Level
Significance
$57,500
Strong support — twice-tested weekly trendline
$55,000
Secondary support zone
$40,000–$35,000
Deep support / worst-case accumulation zone
The $57,500 zone is the line in the sand. As long as Bitcoin holds above it and avoids printing a confirmed lower low with a weekly close below this level, the bullish setup stays intact.
Bitcoin Price Prediction: Long-term support and Target levels
| Level | Significance |
| $70,000 | First major resistance — reclaim this, and sentiment shifts fast |
| $80,000 | Short-term target after $70K breakout |
| $100,000 | Key psychological level — first major target after trendline breakout |
| $126,000 | Previous all-time high — needs to be broken |
| $130,000 | Conservative 2027 ATH target |
| $150,000 | Extended 2027 ATH target if the cycle plays out fully |
The biggest wall for Bitcoin is to cross and close above the $70,000 level. After that, the level has flipped from resistance to support, and getting back above it cleanly would change the mood of this market.
Traders sitting on the sidelines would start paying attention again, and that shift alone can accelerate a move faster than most people expect.
After $70K, the road to $80,000 opens up fairly naturally. It's not a massive structural level, but it matters — it puts Bitcoin back in a range where the six-figure conversation starts all over again.
Then comes $100,000. That number carries a different kind of weight. Breaking it wouldn't just be a price milestone; it would be a confirmation that the cycle is back in full swing. The kind of buying that follows a $100K break tends to be emotional, fast, and bigger than anyone modelled for.
$126,000 is the previous all-time high — the ceiling that needs to crack for this cycle to fully play out. Once that goes, there's no overhead resistance left. Nobody who bought above that level exists, which means breaking above previous all-time highs could increase the probability of BTC testing the $130,000–$150,000 region, although confirmation from market participation would still be required.
Bitcoin Price Prediction 2027 — Short-Term vs Long-Term outlook
Short-Term Outlook — Next 3 to 6 Months
There's no soft way to say this — Bitcoin is at a make-or-break point right now. The $57,500 zone is either going to hold and set up the next leg, or it's going to crack and force a deeper reset before anything meaningful happens.
If it holds, the picture starts building quietly. A higher low forms somewhere in the $57,500 to $62,000 range, the weekly trendline gets its third clean touch and bounces, and slowly the market structure shifts from bearish to neutral to something worth getting excited about. It won't happen all at once, but momentum has a way of feeding on itself once it gets going.
If it doesn't hold if Bitcoin puts in a convincing weekly close below $57,500, then the next real floor sits somewhere between $50,000 and $45,000. That's not the end of the world.
It just means the accumulation zone moves lower and the timeline stretches before the actual move begins.
Every weekly candle closes matters right now. That's the honest reality of where things stand.
LONG-term outlook
The bigger picture hasn't changed at all. Bitcoin's four-year halving cycle has played out with remarkable consistency, and the 2024 halving already did its job of tightening the new supply coming into the market.
History shows the biggest moves tend to arrive 12 to 18 months after a halving, and that window lands squarely in late 2026 through mid-2027.
For the $130,000 to $150,000 targets to become reality, here's the sequence that needs to play out:
-
$57,500 holds — no confirmed weekly close below that level
-
A failed lower low forms — the same signal that kicked off the 2023 rally
-
The weekly trendline holds on its third touch, and Bitcoin closes above it
-
$70,000 gets reclaimed — fear starts turning into something else
-
$100,000 breaks — the path to new all-time high territory opens
-
$109,000 gives way — full bull market back on the table
-
$130,000 to $150,000 — the 2027 target range gets hit
Why Bitcoin Could Still Surprise Everyone in 2027
A few things about this cycle are genuinely different from anything that came before, and they matter more than most people are giving them credit for.
The ETF money is real. Before 2024, getting institutional exposure to Bitcoin meant navigating custodians, private funds, and complicated structures that most large allocators simply wouldn't touch.
The supply situation keeps getting tighter. There are 20.04 million BTC already mined out of a permanent cap of 21 million. The 2024 halving cut the daily new issuance in half again.
So you have an asset with a shrinking supply, a fixed ceiling, and growing institutional demand. That combination has only ever pointed in one direction over a long enough timeframe.
The cycle is rhyming. The 2023 failed lower low that set up the move to $126,000 wasn't random. It was the cycle doing exactly what it has always done — shaking out the weak hands before the real move begins.
The chart right now looks almost identical to that setup. Same pattern, same sentiment, same structure. Whether it plays out the same way is anyone's guess, but the resemblance is hard to ignore.
What Could Go Wrong — Risks Worth Taking Seriously
Not everything goes according to plan, and pretending otherwise doesn't help anyone.
The biggest near-term risk is a clean break below $57,500. If Bitcoin closes a weekly candle convincingly under that level, the bullish structure falls apart.
A move toward $40,000 to $35,000 becomes realistic, and the 2027 ATH timeline gets pushed back significantly. That's the scenario bears are counting on right now.
Macro conditions can always turn. A serious global recession, an unexpected return to aggressive rate hikes, or a major regulatory crackdown on crypto infrastructure could slow institutional demand and dry up ETF inflows at exactly the wrong moment. Bitcoin has weathered macro storms before, but it doesn't make them irrelevant.
Bitcoin Price Prediction 2027 — Final Thoughts
Here's where things actually stand.
Bitcoin is trading at $60,312 today, holding above a trendline support at $57,500 that has been tested and respected twice on the weekly chart.
The structure forming right now — lower highs, lower lows, a potential failed lower low setting up is almost a carbon copy of what played out in 2023 before Bitcoin ran from the low $20,000s all the way to $126,000.
If that pattern repeats, the first stop is $100,000. After that, a push toward $130,000 and eventually $150,000 becomes the 2027 target.
Everything that needs to be in place for that move is there. The institutional money is there. The supply dynamics are there. The chart setup is there. The halving cycle is on schedule.
But the market doesn't care about predictions. $57,500 is the level that matters right now. As long as Bitcoin holds above it and that trendline continues to do its job, every target above it stays in play.
Disclaimer: This article is for informational and educational purposes only. It does not constitute financial advice. Cryptocurrency markets are highly volatile, and past price patterns do not guarantee future results. Always do your own research before making any investment decisions
Also read:
- All Time Low Crypto Coins
- Wiki Cat Price Prediction
- MetaDAO Price Prediction September 2026
- Zcash Price Prediction September 2026
- Blockdag price
- XDC Network partnership with T-Hub
- DOGE price prediction
- One App, All You Need
- What Happened in Crypto Today
- Bitcoin and cryptocurrency growth
- buy ZEXPIRE presale token
2 months ago
HOW TO HIRE A HACKER TO RECOVER STOLEN BITCOIN DIGITAL LIGHT SOLUTION A distinct cryptocurrency company defrauded me. It was a terrible experience losing a large sum to the firm that took both my cash and all of the earnings that I was to make with them over the first three months of my participation. Fortunately, I was reading an article about the benefits and drawbacks of investing in cryptocurrencies at the time and had already accepted my loss and moved on. There, I saw many comments about hackers who could help recover stolen cryptocurrency assets from organizations. I was very persuaded to message Digital-Light-Solution because so many people had left positive reviews of them. I contacted them using their contact information: Email:digitallight-solution@qualityservice.com and WhatsApp 1 9.5.4.8.5.6.8.0.4.5 - https://wa.link/989vlf, and we got in touch. I immediately received a response, and they provided me with directions on how to proceed. To my greatest astonishment, they began returning my money little by little until it was fully restored, exactly as I had given them the Binance wallet addresses. I'm incredibly grateful to Digital-Light-Solution for helping me recover my lost cryptocurrency. Their professionalism, clear communication, and support throughout the process gave me confidence every step of the way. Digital-Light-Solution is more than a service—it’s a lifeline for people who refuse to give up. For victims of cryptocurrency scams, Hire Digital-Light-Solution














.webp)








