Bitcoin Price Prediction 2028: Can BTC Reach $250K?


Bitcoin Price Prediction: Why the 2028 Bitcoin Halving Matters
This Bitcoin Price Prediction:
$BTC price breaks down the long-term weekly trendline, the RSI divergence playing out right now, and the levels that'll likely decide where BTC heads next.
Bitcoin ETF Demand Remains a Key Long-Term Driver
Spot BTC ETFs are still pulling in serious institutional money, even with some short-term outflows showing up here and there.
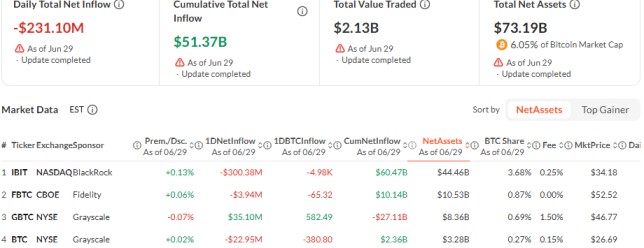
Cumulative net inflows have now crossed $51.37 billion, and total assets under management sit at $73.19 billion, around 6.05% of $BTC entire market cap. BlackRock's IBIT is leading the pack by a wide margin, holding over $44 billion in net assets, which says a lot about how committed traditional investors still are.
Daily flows will keep bouncing around, sure, but the bigger picture, long-term capital steadily moving into Bitcoin ETFs, suggests institutions aren't going anywhere.
If that trend holds up through the next market cycle, it could end up being one of the bigger tailwinds behind Bitcoin's recovery story heading into 2028.
Bitcoin Market Sentiment
As per a tweet on X, CZ is still "extremely bullish" on Bitcoin, and he hasn't backed off that view even with the market cooling down lately.

Meanwhile, there's a bigger event brewing in the background: more than $10B worth of BTC options are set to expire within the next 48 hours. Expirations like this usually bring a burst of volatility right after, and once things settle down, the market often ends up picking a clearer direction for the rest of the quarter.
BTC Right Now: What the Numbers Say
| Metric | Value |
| Current Price | $59,480.75 |
| Market Cap | $1.19T |
| 24h Volume | $30.71B (+58.61%) |
| Total Supply | 21M BTC |
| Circulating Supply | 20.05M BTC |
A nearly 9% drop in a week sounds rough, but it's worth noting where it's happening, right at a zone that has acted as major support before. This isn't some random spot on the chart.
The Weekly Trendline Bitcoin Keeps Respecting
Pull up the BTC/USDT weekly chart and you'll spot a long ascending trendline running all the way back from the 2022-2023 lows. Price has now tapped this exact line twice.
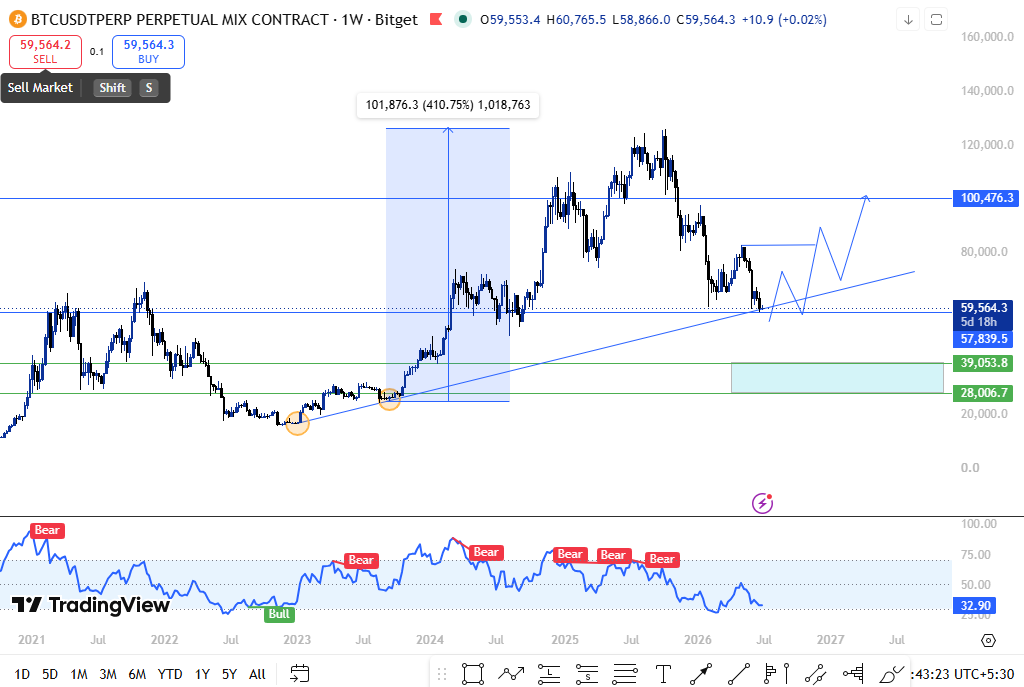
The first tap came in 2023, and what followed was a wild 410% move that carried Bitcoin from the low $20,000s past the $100,000 mark.
Now BTC is leaning on that same trendline for a second time, hovering around the $57,800 to $59,500 zone. Historically, this is exactly where aggressive buyers tend to show up, because if this level gives way, it would mark the first real break in the multi-year uptrend since 2022.
RSI Divergence: A Warning and an Opportunity
The weekly RSI is hovering near 33, well into oversold territory. But there's something more telling happening beneath the surface.
The price keeps printing lower lows, sliding from the recent highs near $125,000 down toward $59,000, yet the RSI isn't confirming that weakness with equally deep lows of its own.
That gap, with price dropping faster than momentum is actually fading, is a classic sign of bullish divergence.
It's not a guarantee that a reversal is coming, but it does hint that sellers may be running out of steam even as the price continues to slide.
Bitcoin Price Prediction 2028: Key Breakout Levels to Watch
$57,800 is the line that matters most right now. As long as Bitcoin holds above it, the trendline support stays intact and the bullish case for a recovery remains on the table.
If BTC manages to reclaim $83,500 and close above it on the weekly, that would go a long way in confirming the trendline bounce is the real deal and that momentum has shifted back toward buyers.
A confirmed weekly close above that level would open the door toward $100,000, a level $BTC has already proven it can reach once trendline support holds firm.
Push past $100,000, and the old all-time high near $125,000 becomes the next real test. Clearing that with strong volume behind it would put fresh highs back on the table as 2028 approaches.
On the flip side, a weekly close below $57,800 would break this multi-year trendline structure and likely send Bitcoin back down to retest the $39,000 to $40,000 demand zone.
Bitcoin Price Prediction 2028: BTC Targets Forecast
| Timeframe | Scenario | Min Target | Max Target | Key Trigger |
| Q3 2026 | Base Building | $50,000 | $65,000 | Trendline support holds |
| Q4 2026 | Recovery Attempt | $65,000 | $83,500 | RSI divergence confirms |
| Q1 2027 | Breakout Phase | $100,000 | $150,000 | Weekly close above $83,500 |
| 2028 | Cycle Extension | $150,000 | $250,000 | New highs, macro tailwinds |
Bitcoin Price Prediction 2028: Risk and Reward
| Factor | Bull Case | Bear Case |
| Trendline Support | The second bounce repeats the 2023 setup | Breaks, structure turns bearish |
| RSI Divergence | Confirms sellers are losing strength | Divergence fails, RSI breaks lower |
| $83,500 Resistance | Flips to support: $100K opens up | Rejected again, range drags on |
| Options Expiry Volatility | A sharp move favors the trendline holding | A sharp move triggers a breakdown |
| $57,800 Support Zone | Holds, aggressive buyers step back in | Breaks, drops toward $39,000-$40,000 |
Bitcoin Price Prediction 2028: Expert View
Analysts tracking BTC's weekly chart note that a second successful test of a trendline that previously triggered a 410% rally, combined with a clear RSI divergence, is the kind of setup worth watching closely.
A confirmed close above $83,500 would be the strongest signal that the next leg toward $100,000 and beyond is underway. Until then, the $57,800 zone remains the level that decides everything.
Disclaimer: This article is written for educational and informational purposes only. Nothing here is financial advice. Cryptocurrency markets are volatile and unpredictable. All analysis is based on publicly visible chart data and historical patterns. Always do your own research before making any financial decisions.