Bitcoin to $600K? Peter Brandt’s BTC Price Prediction for Late 2029


Veteran trader Peter Brandt sees a Bitcoin cycle top of $300,000 to $600,000 in late 2029. He expects BTC near $250,000 by early 2029 first.
The near term looks less clear. Bitcoin fell to about $82,900 on September 28, 2026, down 2.31% in 24 hours, after trading near $84,000 over the weekend.
Here is the latest Bitcoin news today, plus what analysts say could come next.
What Is the Bitcoin Price Today?
The Bitcoin price today is $82,908.7, down $1,960.48. Market cap sits near $1.66 trillion.
Metric | Value |
$BTC price | $82,908.7 |
24-hour change | -2.31% |
Market cap | $1.66 trillion |
Futures volume (24h) | $51.55 billion |
Spot volume (24h) | $4.59 billion |
Open interest | $54.19 billion |
Circulating supply | 20.09 million |
Futures volume is far bigger than spot volume, so derivatives traders drive most of the action.
Why Is BTC Down Today?
President Trump rejected Iran's offer to reopen the Strait of Hormuz. Iran wanted the US to lift its naval blockade and sanctions in return.
The Bitget breach is also still in the news. The exchange now puts the loss at $387.5 million. Withdrawals are reopening in phases, starting with BTC. Ethereum, USDT, and other assets follow through October 2.
Even so, the drop stayed orderly, with no messy break.
Is $BTC Bullish or Bearish Right Now?
The derivatives data is mixed.
Indicator | Reading |
Long/short ratio (24h) | 0.8843 |
Binance BTC/USDT accounts | 1.3164 |
OKX BTC accounts | 1.35 |
Binance top traders (accounts) | 1.426 |
Binance top traders (positions) | 1.8546 |
A reading under 1 means more shorts than longs. The overall ratio leans slightly bearish, while Binance and OKX lean long.
Liquidations hit $89.83 million in 24 hours. Longs took most of the pain.
Period | Long | Short | Total |
1 hour | $558.90K | $305.65K | $864.55K |
4 hours | $8.76M | $548.39K | $9.31M |
12 hours | $71.04M | $8.42M | $79.47M |
24 hours | $78.15M | $11.68M | $89.83M |
Longs made up about 87% of the 24-hour total.
Options tell a second story. Options volume jumped 169.42% to $2.91 billion, and options open interest rose 1.75% to $34.49 billion.
Futures open interest slipped 1.93% to $54.28 billion. More traders may be using options for protection.
What Does the $BTC Chart Show Today?
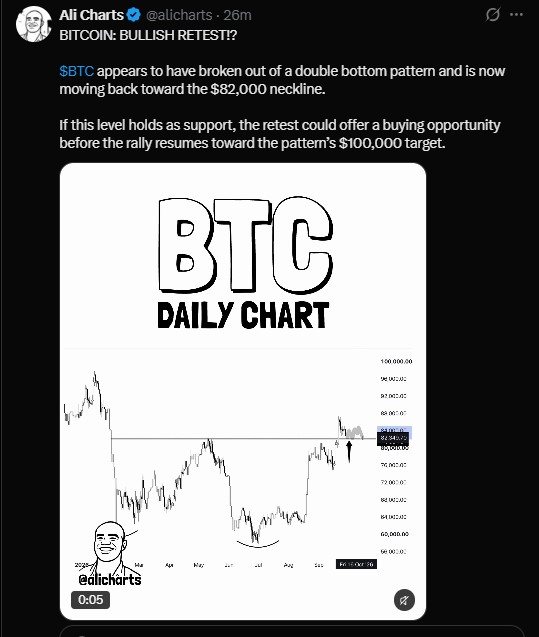
Analyst Ali Charts points to a double-bottom pattern on the daily chart. The lows formed around June and July.
Price then broke out. Now it is moving back toward the $82,000 neckline for a retest.
If $82,000 holds as support, it could offer a buying chance. The pattern target is $100,000. If it fails, the breakout may prove false.
Level | Why it matters |
$100,000 | Double-bottom target |
$84,000 | Weekend trading area |
$82,000 | Neckline and key support |
$65,000 to $66,000 | Brandt's "tradable low" zone |
What Is Peter Brandt Saying About BTC?
Veteran trader Peter Brandt called for a bottom on October 4. The market instead bottomed in late June, so his call was off by 6 to 7 weeks.
"I'm kind of back to the drawing board," he said. Still, he sees a good shot that the June low started a new bull market.
But he also hopes for one more dip. He wants a tradable low near $65,000 to $66,000 in early October.
Why? A dip clears out traders who piled in. It also lets whales buy at lower prices. That would be about a 20% fall from today.
How High Can BTC Go? Peter Brandt's Forecast
Brandt expects $BTC near $250,000 by early 2029. He then sees a cycle top between $300,000 and $600,000 in late 2029.
Brandt's timeline | Level |
Tradable low, early October 2026 | $65,000 to $66,000 |
Next halving | April 2028 |
Early 2029 | About $250,000 |
Cycle top, late 2029 | $300,000 to $600,000 |
Note that $600K is the top of his range, not a single target.
He ties this to the next halving, due in April 2028. The top should come as far after the halving as the June low came before it.
He called $100,000 by year-end "unimportant" and said he is not a $1 million bull.
On quantum risk, Brandt said a real hack would make him want to "short everything in the world of Bitcoin." Still, he said it would never go to zero, because "there's always a sucker that wants to own it."
He added that experts he trusts believe the network cannot be hacked, and could be patched if it were.
Is BTC ETF Demand Coming Back?
Crypto Rover shared a 30-day ETF demand chart. It shows demand turning up after a deep dip around June.
His post says ETF demand is back and adds that smart money knows BTC will hit $150,000 soon. That is his view, not a fact.
Both ETF demand and price fell hard in June, then climbed again into September.
Some link ETF inflows to the market shrugging off the Iran and Bitget news. That link is correlation only.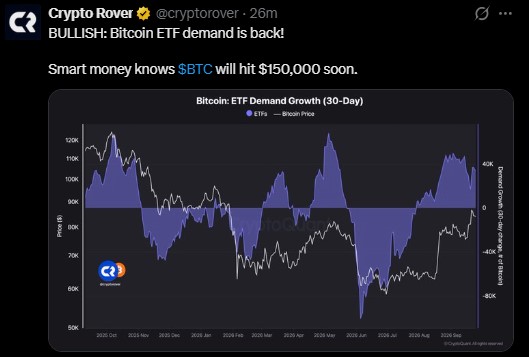
Will BTC Go Up in October?
Uptober starts in two days. On-chain analyst DeFiTracer says eight of the last 10 Octobers closed higher.
Michael Saylor also teased more Strategy buying with a post that read "Even more orange." Past months do not promise future results.
What Will Move the BTC Price This Week?
The 10-year Treasury yield is at a high of 5.230%. The DXY dollar index is near 101.
Day | Report | Forecast |
Tuesday | JOLTS job openings | 7.24 million |
Wednesday | August core PCE | +0.3% monthly |
Wednesday | Q2 GDP (final) | 1.5% annualized |
Thursday | ISM manufacturing PMI | 54.9 |
Thursday | S&P Global manufacturing PMI | 57 |
Friday | September jobs report | +84,000 (August: 162,000) |
Friday | Unemployment rate | 4.1% |
Higher yields and a stronger dollar often weigh on risk assets. White House crypto advisor Patrick Witt also said the SEC and CFTC will deliver crypto regulation.
What Is the Latest BTC News Today?
Here are the main BTC news headlines in one place.
Headline | Detail |
Trump rejects Iran proposal | Hormuz reopening offer turned down |
Bitget breach | Loss now $387.5 million |
ETF demand | Chart shows a rebound |
Strategy | Saylor hints at more buying |
Regulation | SEC and CFTC to deliver crypto rules, says Patrick Witt |
What Is the Bitcoin Price Prediction for This Week?
This Bitcoin price forecast is built on the data above. None of it is guaranteed.
Scenario | What would need to happen | Possible level |
Bullish | $82,000 holds, ETF demand grows | $100,000 |
Neutral | Price ranges near the neckline | $80,000 to $84,000 |
Bearish | $82,000 breaks, yields keep rising | $65,000 to $66,000 |
A dip first and a rally later is one path some traders discuss. Any BTC price forecast depends on where the coin closes around $82,000 this week.
Disclaimer
This article is for information only. It is not financial, investment, or trading advice. Crypto assets are volatile and carry a high risk of loss. Price predictions and analyst views are opinions, not guarantees. Do your own research and speak with a licensed financial advisor before investing. Never invest money you cannot afford to lose.

















