Cardano Price Prediction: Why Is ADA Up 8.67% Today? Eyes $0.40

There is a reason traders keep circling back to ADA charts this week, and it has nothing to do with hype.
Something has shifted in the structure of the move, and anyone searching for a fresh cardano price prediction right now is going to want to see exactly where this trend could go next.
Before diving in, a quick note: this is a purely chart-based and data-driven reading, not a personal position or financial advice.
Cardano Price Today: Live Data
ADA is changing hands at $0.2506, up 8.67% on the day. Futures volume over the past 24 hours sits at $988.85M against spot volume of $202.02M, showing that leveraged positioning is doing most of the heavy lifting in this move.
Open interest is at $611.82M, and market cap stands at $9.21B. Circulating supply is 36.76B ADA out of a total supply of 44.99B and a hard cap of 45.00B, so there is not a lot of new supply left to enter the market long term.
Source: CoinGlass, September 22, 2026
Cardano News Today
The bigger Cardano news today is not about price at all. Cardanians, a well-followed Cardano-focused account, posted that Cardano has been officially added to the x402 SDK. 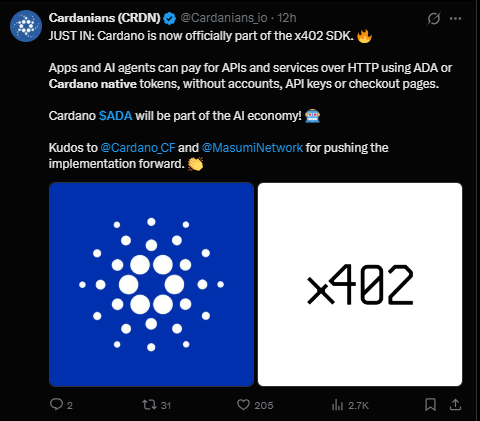
In plain terms, this means apps and AI agents can now pay for APIs and services directly over HTTP using ADA or other Cardano native tokens, skipping accounts, API keys, and checkout pages entirely.
The post credited the Cardano Foundation and Masumi Network for pushing the integration forward, framing it as ADA becoming part of the machine-to-machine payment layer that AI agents are expected to rely on.
This kind of infrastructure news tends to matter more for the multi-year Cardano price prediction story than for tomorrow's candle, but it is worth flagging because it adds another real-world use case to a coin that already carries the payments and staking narrative.
Source: Cardanians on X, September 22, 2026
Quick Take
CMP: $0.2500 on the 4-hour Binance perpetual chart
Bullish trigger: close above $0.2586
Bearish trigger: close below $0.2183
Data timestamp: September 22, 2026
Risk note: this entire setup is built around a single trendline reclaim, so a fake breakout above $0.2586 remains possible before any bigger move plays out
Cardano Price Prediction 2026 Technical Analysis
Zooming into the 4-hour ADA/USDT perpetual chart on Binance, the story is fairly clean. ADA spent most of early September grinding sideways to lower, then found a floor and started climbing along a well-respected ascending trendline. 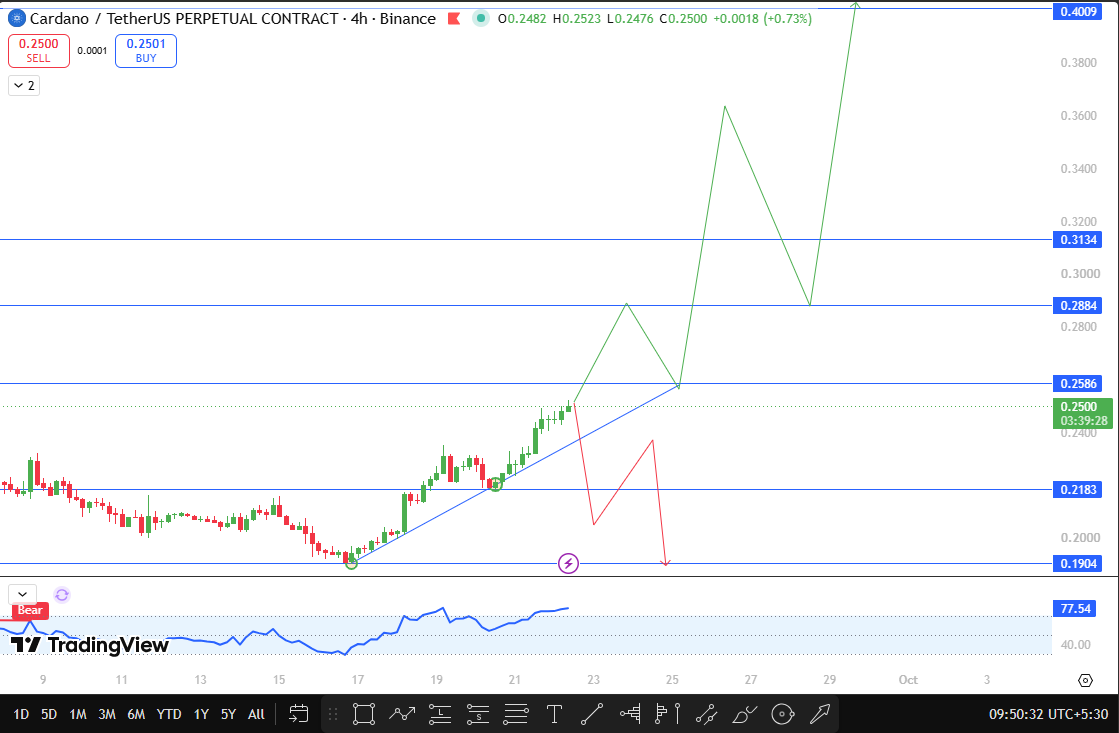
That line has now been tested and held, and what makes this retest interesting is that price did not just bounce; it actually pushed through to a new higher high before pulling back slightly to sit at $0.2500 as of this writing.
That is generally read as a sign of underlying strength rather than a one-off spike, since dips into support are being bought rather than sold into.
The oscillator sitting below the chart is currently printing a reading of 77.54, well above the 40 zone it was hovering near earlier in the month, even though it carries a Bear label on this particular setup.
Readers should treat that purely as a data point rather than a signal on its own, since the trendline structure above is doing most of the talking here.
If ADA manages a clean close above $0.2586, that would confirm the breakout out of the current consolidation range and open the path toward $0.2884.
From there, $0.3134 becomes the next hurdle, and further out, a break of that zone puts the much bigger $0.4009 level in play, which would represent a return toward levels not seen in a while.
On the flip side, if the trendline fails and ADA closes below $0.2183, the next real support sits at $0.1904, and a break there would suggest the recent strength was more of a relief bounce than a genuine trend change.
Cardano Support and Resistance Levels
Level Type | Price | Distance from CMP ($0.2500) |
Major Resistance | $0.4009 | 60.36% above |
Resistance 3 | $0.3134 | 25.36% above |
Resistance 2 | $0.2884 | 15.36% above |
Resistance 1 | $0.2586 | 3.44% above |
Current Price | $0.2500 | - |
Support 1 | $0.2183 | 12.68% below |
Support 2 | $0.1904 | 23.84% below |
ADA Bull, Base, and Bear Case
In the bullish scenario, ADA holds above its ascending trendline, closes above $0.2586, and rides the momentum from the x402 SDK news and rising open interest toward $0.2884 first, with $0.3134 as a stretch target if buying pressure does not run out of steam.
Traders who like to lean on volume will note that futures volume is already nearly five times spot volume, which tells you this rally has plenty of leveraged fuel behind it, for better or worse.
In the base case, ADA spends more time chopping between $0.2183 and $0.2586 before committing to a direction.
Given how fast the price has already run in the past 24 hours, up 8.67% and counting, a pause to digest gains here would not be unusual and would actually strengthen the setup if the trendline holds through it.
In the bearish scenario, the trendline gives way, the price closes below $0.2183, and the higher high seen on this retest ends up being the last gasp of the move rather than a continuation signal.
That would put $0.1904 back on the radar fairly quickly given how leveraged the current move appears to be.
Risks to Watch
Because so much of this move is being driven by futures positioning rather than spot demand, any sharp move against the trend could trigger a wave of liquidations that exaggerates the swing in either direction.
Broader crypto market sentiment, Bitcoin dominance shifts, and any regulatory headlines around AI agent payments could also move ADA independently of its own chart structure.
As always, a single trendline break is not proof of a trend reversal until the price actually closes there and stays there.
Cardano Price Prediction 2030 Long-Term Outlook
Push the lens out to 2030, and Cardano's story starts to look less about candles and more about plumbing.
A blockchain that lets AI agents settle payments without accounts or API keys is solving a problem that barely existed a few years ago, and Cardano getting folded into the x402 SDK alongside partners like the Cardano Foundation and Masumi Network puts it right in the middle of that shift. If machine-to-machine commerce grows the way most infrastructure builders expect: a fixed supply asset with real settlement rails behind it has a genuine shot at being priced meaningfully higher than today, though nobody can put an exact number on that kind of structural bet with any honesty.
Glossary
Ascending Trendline: A line drawn along a series of rising lows, used to mark ongoing upward momentum
Higher High: A price peak that sits above the previous peak, often read as a sign of continued strength
Open Interest: The total value of outstanding futures contracts that have not yet been settled
Support and Resistance: Price zones where an asset has historically struggled to break through or fall below
Disclaimer
This article is for informational purposes only and should not be treated as financial or investment advice. Cryptocurrency markets are highly volatile, and readers should conduct their own research before making any trading decisions.