Can Infinity Ground Hit $1? Infinity Ground Price Prediction 2026–2030


A quiet chart just turned loud. Infinity Ground (AIN) broke out of a pattern that had been squeezing tighter for months, and the candle that did it wiped out a chunk of short positions in one session. Traders who'd written the coin off are checking it twice a day now. Whether that momentum survives the next few candles is the real question here.
Why AIN's Breakout Candle Has Traders Watching Again
Infinity Ground price prediction searches are picking up after AIN staged one of its sharpest moves since spring. A coin that spent months grinding sideways suddenly snapped higher, and that rarely happens without a reason. Similar breakout patterns across smaller-cap tokens sit on the memecoin news desk.
Breakouts split a market fast. One camp sees a bottom confirmed. The other sees a trap built to pull in buyers before sellers return.
A token rebrand sits in the background too, plus a pitch about being the chain for "vibe coders." None of that shows on a candlestick.
So what pushed the price?
Quick Prediction Box
Metric | AIN |
Current Price | $0.1101 |
24H Change | +56.16% |
Market Cap | $35.16M |
24H Volume | $3.61M |
Trend | Bullish |
RSI | 75.03 (Overbought) |
MACD | Bullish crossover, histogram widening |
Immediate Support | $0.0680 |
Immediate Resistance | $0.1317 |
Next Target | $0.1773 |
Bull Case | $0.25 |
Base Case | $0.14 |
Bear Case | $0.055 |
Invalidation | Daily trade below $0.068 |
Snapshot taken at 18:01 UTC on September 14, 2026. Figures should be refreshed immediately before publication.
Infinity Ground Price Prediction Today
AIN Current Price and 24-Hour Performance
AIN trades near $0.1101, up 56.16% over 24 hours, swinging from a low near $0.0681 to a high above $0.114. Won't every trader wish they'd caught that low?
AIN Trading Volume and Market Cap
Volume sits near $3.61 million, up over 124% on the day. Market cap runs close to $35.16 million against a fully diluted value near $110.23 million, per live figures on CoinMarketCap.
AIN Short-Term Trend
The short-term trend turned bullish. But one candle doesn't rewrite months of chop.
Infinity Ground Technical Analysis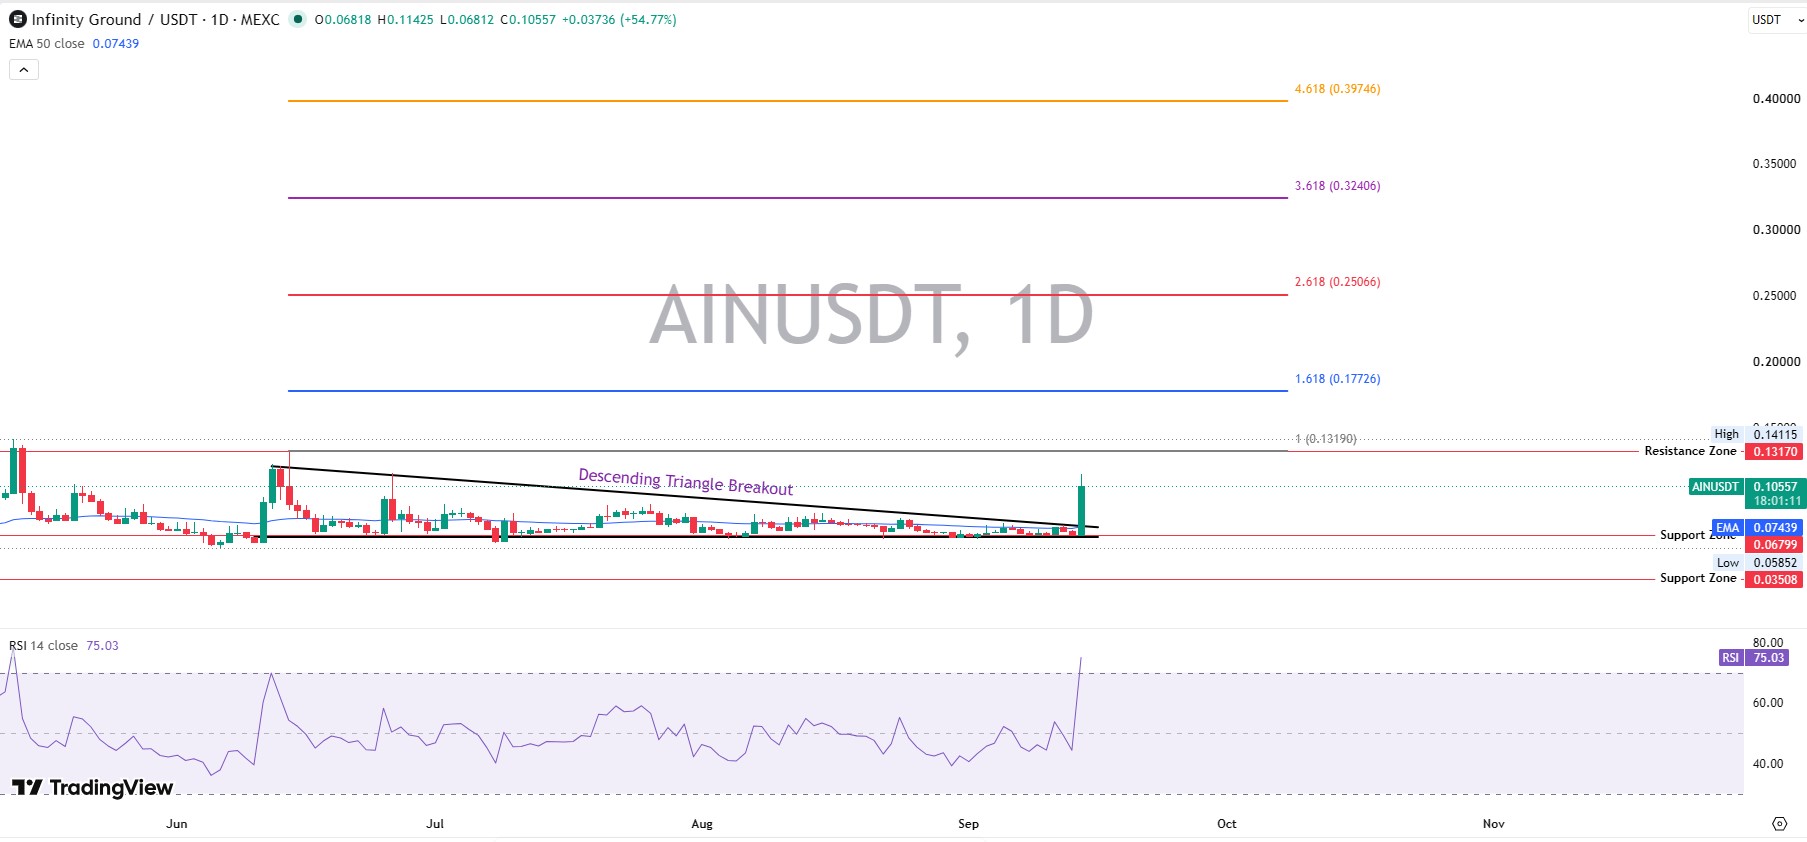
AIN Support Levels
Immediate support sits near $0.068, the shelf AIN built before breaking out. A deeper floor sits near $0.035.
AIN Resistance Levels
Overhead resistance clusters near $0.1317, tied to a prior high visible on TradingView. Extensions follow near $0.177 and $0.251.
RSI Analysis
RSI, a momentum gauge on a 0-100 scale, sits at 75.03. Above 70 usually flags overbought conditions. Stretched moves pause.
MACD Analysis
MACD shows the line above the signal line, with a widening green histogram, a bullish crossover timed almost with the breakout.
Moving Average Trend
Trading sits well above the 50-day EMA near $0.0744, a gap wide enough to suggest strength, and wide enough to invite a pullback.
Volume Confirmation
Volume expanded alongside price. A spike in shrinking volume would've been a red flag. Not this time.
Infinity Ground Price Prediction for 2026
Bear case: a slide toward $0.045 to $0.06 if support at $0.068 fails.
Base case: consolidation between $0.09 and $0.14 as price digests the spike.
Bull case: a push toward $0.20 to $0.25 if volume holds and Bitcoin stays supportive.
Upcoming catalysts sit on the coin events calendar. Losing $0.068 on a daily trade undercuts the setup.
Infinity Ground Price Prediction 2027
Scenario ranges beat a single number this far out.
Bear: $0.04 to $0.08 if adoption stalls.
Base: $0.12 to $0.22 with steady growth.
Bull: $0.30 to $0.45, tied to real dApp traction.
Infinity Ground Price Prediction 2028
Bear: $0.05 to $0.10.
Base: $0.18 to $0.35.
Bull: $0.50 to $0.75, contingent on Infinity Ground becoming the developer chain it claims to be.
Infinity Ground Price Prediction 2029
Bear: $0.07 to $0.15, a market that never found its next catalyst.
Base: $0.25 to $0.50.
Bull: $0.80 to $1.10, needing a sticky user base, not just speculative volume.
Infinity Ground Price Prediction 2030
Here's the market-cap reality check. If AIN reached $1 on today's circulating supply of 318.96 million tokens, the implied market cap lands near $319 million.
Against the full max supply of 1 billion AIN, that price implies close to $1 billion.
Bear: $0.09 to $0.20.
Base: $0.35 to $0.65.
Bull: $1.00 to $1.50, leaning on unlocks getting absorbed by real demand.
AIN Bull Case vs Base Case vs Bear Case
Scenario | Price Zone | What Must Happen | Risk |
Bull | $0.20-$0.25 | Breakout holds, volume expands, new listings land | Failed breakout, momentum fades |
Base | $0.09-$0.14 | Consolidation, steady demand, no major shocks | Weak liquidity stalls price |
Bear | $0.045-$0.06 | Support failure, risk-off crypto market | Deeper breakdown toward $0.035 |
What Could Drive Infinity Ground Higher?
Project/Ecosystem Growth
A push into gaming, art, and education, dApps matter more than any chart pattern; updates surface on AI crypto news.
Exchange Listings
New listings widen liquidity; the exchange listing tracker flags upcoming ones.
Adoption and User Growth
A holder count near 18,250 is modest. Growth here, plus activity on the airdrop tracker, would be a clear bullish signal.
Tokenomics
Treasury and community allocations sit at 20% and 15%, funding growth without flooding supply if managed well.
Market Liquidity
Liquidity against market cap sits near 5.69%, thin enough to cut both ways.
Bitcoin and Altcoin Market Conditions
Small caps rarely move against the tide. A strong Bitcoin backdrop lifts AIN's odds, and interest is spreading to other AI-linked altcoins too, including presale-stage projects like Ozak AI.
What Could Push AIN Lower?
Support Breakdown
A daily trade below $0.068 opens the door toward $0.035 fast.
Token Unlock/Supply Pressure
Only 318.96M of 1B AIN circulates, unlocking carry real dilution risk.
Weak Trading Volume
Fading volume risks the rally running out of fuel.
Whale Selling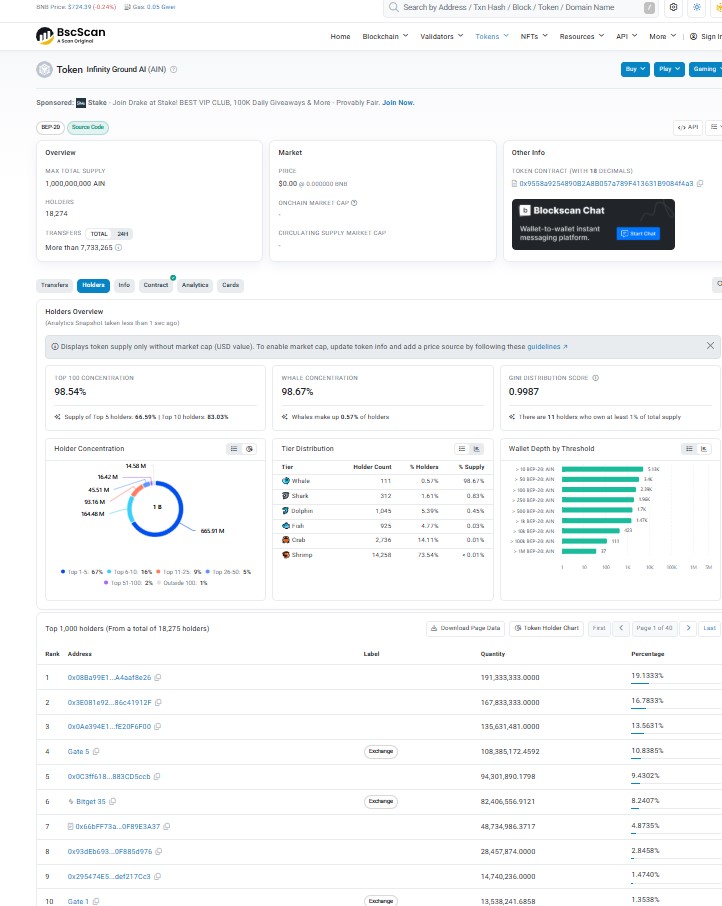
Whale concentration here is extreme. BscScan shows the top 100 wallets hold 98.54% of supply, and whale-tagged wallets alone hold 98.67%.
Bitcoin Downtrend
A broad downturn would drag AIN lower regardless of its own setup.
Liquidity Risk
Thin liquidity means large orders move the price hard.
AIN Price Prediction Invalidation Levels
The bullish thesis holds above $0.068. A daily close below that weakens the setup and shifts focus toward $0.035. This isn't a guarantee, just a marker; broader forecast methodology sits on the price prediction hub.
Can Infinity Ground Reach $0.10?
The price already trades above $0.10, so the real question is whether it holds there. That needs $0.068 in support intact and volume keeping pace.
At current supply, $0.10 implies a market cap near $31.9 million, well inside reach given AIN's all-time high of $0.2057. Resistance at $0.1317 stands between the current price and proof that $0.10 is a floor, not a ceiling.
Can AIN Reach $1?
Reaching $1 needs roughly an 809% increase from here, implying a market cap near $319 million on today's supply, or close to $1 billion against the full max supply.
That's nearly five times AIN's all-time high. Not impossible. But it needs adoption and volume; the token hasn't shown yet. Current liquidity makes this a multi-year proposition, not a near-term one.
Disclaimer
This article is for informational purposes only and does not constitute financial, investment, or trading advice. Cryptocurrency markets are highly volatile, and prices can change rapidly. Price predictions rely on technical analysis, tokenomics, and current market data and carry no guarantee of accuracy. Readers should conduct independent research and consult a qualified financial advisor before making investment decisions.









.jpg)








