NEAR Price Prediction 2026-2030: Can This Breakout Hold?


NEAR price today sits at $3.53 as of September 20, 2026, 09:25 UTC. That's down 3.33% in 24 hours, yet up 48.87% in seven days.
This NEAR Protocol price prediction puts levels first, like solid crypto price predictions do.
Trend is bullish after an ascending channel breakout, and $1.18B in 24-hour volume backs it. Support sits at $3.43, resistance at $3.95.
But RSI, a 0-100 momentum gauge, reads 74.92. Above 70 means overheated.
Confirmation needs a daily push above $3.95 with volume. Trading below $2.27, the 50-day average, cancels the setup.
NEAR Price Prediction Quick Snapshot
Metric | Current Snapshot |
Current Price | $3.53 |
24H Change | -3.33% |
Trend | Bullish, stretched |
Next Target | $3.95, then $5.41 |
Support | $3.43, then $2.27 |
Resistance | $3.95 |
RSI | 74.92 |
Bull Case | $5.41-$7.84 |
Base Case | $3.00-$4.50 |
Bear Case | $1.57-$2.27 |
Invalidation | Daily trading below $2.27 |
NEAR Protocol Price Today and Market Snapshot
Current NEAR Price, Market Cap and Volume
NEAR trades at $3.53 as of September 20, 2026, 09:25 UTC. Down 3.33%. Up 48.87% in seven days.
NEAR market cap stands at $4.62B, ranking #20, with $1.18B in volume, per CoinMarketCap market data.
Supply: 1.3B NEAR.
All-time high: $20.42 on January 17, 2022. Price sits 82.69% below it.
NEAR Trend and Momentum
Daily trend: up. Weekly trend: stronger, with 30-day gains of 100.07%.
The 50-day EMA, an average that weights recent trades more, sits at $2.27. Price trades 56% above it.
Turns out, volume fell 31.23% on the pullback, which reads like a top. Actually, no: 25.68% turnover says buyers stay active.
NEAR Technical Analysis and Key Price Levels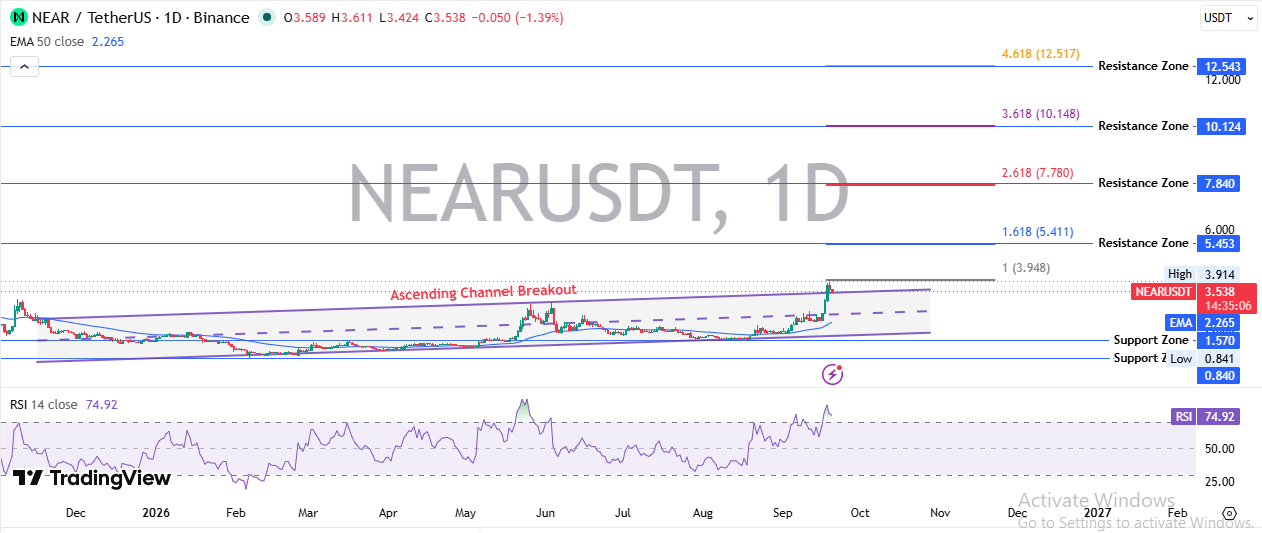
Binance's NEAR/USDT pair on TradingView daily charts anchors the NEAR technical analysis.
NEAR Support Levels
NEAR support levels begin at $3.43, the 24-hour low near the broken channel top. Hold it, and the breakout stays intact.
Next: $2.27, the 50-day EMA, then $1.57 and $0.84, the chart low.
NEAR Resistance Levels
NEAR resistance levels start at $3.91, then $3.95, a Fibonacci extension, a projection tool built from a prior swing.
Higher targets: $5.41, $7.78, $10.15 and $12.52.
Price stalled at the channel top in late May. And no moving average sits overhead.
RSI and MACD Signals
RSI reads 74.92. In late May, a similar reading preceded weeks of cooling.
MACD, a trend tool built from two moving averages, reads 0.386 versus a 0.256 signal line.
When we pulled up the RSI, the first thing that stood out was how fast it climbed.
Basically, trend strength is real, but entries are expensive. Chasing $3.53 is a poor trade.
Breakout Confirmation and Invalidation
Scenario | Trigger | Target Zone | Invalidation |
Bull | Daily trading above $3.95 with volume | $5.41-$5.45 | Failed breakout below $3.43 |
Base | Range holds above $3.43 | $3.43-$3.95 | Breakdown below $3.43 |
Bear | Support loss at $3.43 | $2.27, then $1.57 | Reclaim of $3.43 |
NEAR Price Prediction for the Next 7 Days
Daily numbers carry wide error bars.
24H: $3.43-$3.74.
3-day: $3.40-$3.95.
7-day: $3.20-$4.00, with RSI cooling below 70.
Resistance: $3.95.
Support: $3.43. Volume must confirm any rebound.
BTC is the wildcard. And NEAR trades at 0.000044 BTC, so a BTC slide drags it lower.
NEAR Price Prediction for October 2026
Expected trading range: $3.20-$4.50.
Bull: a daily push above $3.95 aims at $5.41-$5.45.
Base: chop between $3.20 and $4.00 while RSI resets.
Bear: losing $3.43 opens $2.27-$3.00. Invalidation sits at $2.27.
Catalyst: the next NEAR@X rewards phase, plus dates on a crypto events calendar.
Risk: profit-taking after a 100.07% monthly run. And a weak BTC would amplify it.
NEAR Price Prediction 2026
Bull Case
NEAR price prediction for 2026 bull case needs three things: daily trading above $3.95, rising volume, and an RSI that cools without breaking trend.
Then $5.41-$5.45 opens, and $7.84 becomes the stretch.
Base Case
The base case isn't dull. It's consolidation between $3.00 and $4.50 while buyers defend the old channel top.
Bear Case
Downside triggers: a failed retest of $3.43, thin altcoin liquidity, and rising BTC dominance. Path: $2.27, then $1.57.
NEAR 2026 Target and Market-Cap Math
Price times circulating supply (1.3B NEAR) gives implied market cap.
Target | Price | Implied Market Cap |
Recent high | $3.95 | $5.14B |
Resistance one | $5.45 | $7.09B |
Resistance two | $7.84 | $10.19B |
All-time high | $20.42 | $26.55B |
NEAR Price Prediction 2027-2030
NEAR price prediction 2027-2030 works in ranges only. A single 2030 number would be false precision.
Year | Bear Case | Base Case | Bull Case | Main Driver |
2027 | $1.50-$3.00 | $3.50-$6.00 | $7.00-$10.00 | Adoption and liquidity |
2028 | $1.50-$3.50 | $4.50-$8.00 | $9.00-$14.00 | Chain abstraction |
2029 | $2.00-$4.00 | $5.00-$10.00 | $11.00-$16.00 | Ecosystem growth |
2030 | $2.00-$4.50 | $6.00-$12.00 | $13.00-$20.00 | Network usage |
At $20, the NEAR price prediction for the 2030 top end would roughly retest the $20.42 all-time high.
What Could Drive NEAR Price Higher?
NEAR Intents and Chain Abstraction
NEAR Intents, a system where solvers route user-stated outcomes across chains, passed $27B in volume.
Confidential TVL, meaning assets deposited in privacy tools, hit $90M, per an official NEAR Protocol update.
Locked deposits trim supply, while chain abstraction widens the buyer pool.
AI Infrastructure Narrative
Holders staked 500,000+ NEAR to power confidential inference.
Small today, but it ties token demand to AI usage. Follow AI crypto news for rotation.
Network Adoption and Developer Activity
Nearblocks shows 5.44B transactions, 11 TPS and 413 active validators.
If usage keeps climbing. Then fee and staking demand should follow.
Broader Altcoin Liquidity
When BTC stalls, capital rotates into altcoins, often visible first in memecoin news.
More liquidity lifts NEAR through beta, its tendency to move harder than BTC.
What Could Push NEAR Lower?
What happens when crowded longs meet a broken $3.43?
Bitcoin Dominance
Bitcoin dominance, BTC's share of total crypto value, drains altcoin liquidity when rising.
Weak Altcoin Liquidity
Thin liquidity means thinner bids. Volume already fell 31.23%.
Supply and Inflation
Staking issuance keeps adding supply, and airdrop-style rewards such as NEAR@X could add sell pressure.
Failed Breakout
Price sits at the channel top. A slide back inside flips the story.
And if that comes on heavy selling. Then $2.27 arrives fast.
Loss of Key Support
Open interest, the value of outstanding futures, stands at $978.43M, per Coinglass derivatives data.
Longs took $3.16M of $3.98M in 24-hour liquidations, forcing position exits.
NEAR On-Chain and Whale Activity
NEAR whale activity can't be confirmed from exchange-balance or large-transfer data here, and guessing would only add noise.
Confirmed: 13.7K holders and 413 active validators.
When we checked Coinglass, Binance's top-trader long/short position ratio of 3.2017 stood out immediately.
Big accounts lean long. Crowded trades cut both ways.
NEAR vs. Bitcoin and the Altcoin Market
Basically, BTC sets the tide. BTC direction drives dominance, dominance drives altcoin liquidity, and liquidity drives NEAR.
NEAR's beta amplifies both directions. And new exchange listings can pull liquidity away from established names.
NEAR trades at 0.000044 BTC. Holding that ratio would confirm strength beyond BTC.
What Could Invalidate the NEAR Bullish Setup?
Invalidation matters more than targets.
Support breakdown below $3.43, then $2.27
Failed resistance reclaim at $3.95
Falling volume on rallies
RSI divergence: higher price highs, lower RSI highs
BTC breakdown
Rising BTC dominance
Negative ecosystem or on-chain data
NEAR Trader Takeaway
Watch:
Support: $3.43
Breakout level: $3.95
Volume: near $1.18B daily
RSI: cooling from 74.92
BTC direction and BTC dominance
Catalysts: next NEAR@X phase, confidential perpetual futures live since September 18, 2026
Confirmed data: price, volume, RSI, MACD. Scenario analysis: every range and target.
Stance: bullish structure, patient entries.
Disclaimer
This content is informational only and isn't financial advice. Crypto is volatile, and every target is a scenario, not a guarantee. Readers should research independently.


















