Pendle Price Prediction: Can PENDLE Climb Past $10 in 2026?

Pendle spent months going nowhere, stuck below a key long-term moving average while the rest of the market moved on without it. That has changed in a hurry.
The token has broken out of its old range and is now carving out a steady staircase of higher lows, the kind of structure that tends to keep drawing buyers back in on every dip.
This Pendle price prediction looks at how the token is positioned across derivatives and wallets and whether the current structure has enough behind it to keep climbing or whether it is due a breather.
PENDLE Price Today: Where the Breakout Stands
Pendle (PENDLE) is trading near $2.5983 at the time of writing, according to Coinglass data, up 9.26% over the past 24 hours.
Market cap sits around $454.79 million, with a circulating supply of 173.59 million $PENDLE against a total supply of 281.52 million and a max supply of 258.44 million tokens.
Twenty-four-hour futures volume of $114.90 million against spot volume of $17.08 million shows derivatives traders leading this move by a wide margin.
PENDLE Performance, Positioning, and Where the Volume Is Coming From
The multi-timeframe picture backs up the strength. Per Coinglass tracking, $PENDLE is up 1.81% on a 4-hour basis, 9.36% over 24 hours, and 10.78% across the past seven days, part of a run that anyone checking a PENDLE price prediction 2026 would want context on: 51.88% over 30 days.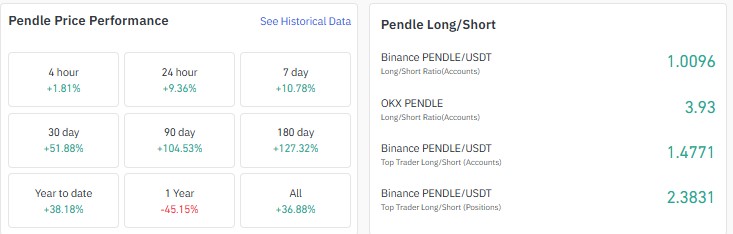
A sharp 104.53% over 90 days and 127.32% over 180 days, with the token still up 36.88% from its all-time low despite sitting 45.15% below its one-year mark.
The long-short ratio leans firmly toward longs across venues: Binance's PENDLE/USDT account ratio sits at 1.0096.
OKX runs much hotter at 3.93, and Binance top-trader accounts sit at 1.4771 and top-trader positions at 2.3831.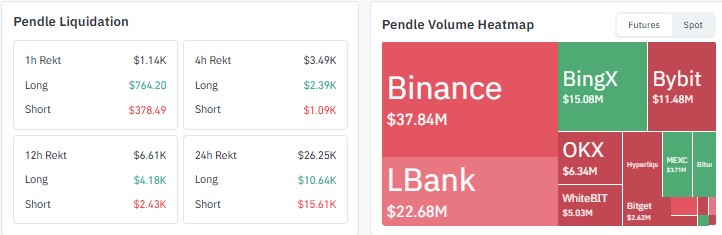
Liquidations back that skew, with $26.25K wiped out over 24 hours, $15.61K of it from short positions against $10.64K in longs, while volume is concentrating on Binance at $37.84M, ahead of LBank and BingX.
Pendle Open Interest Has Climbed Steadily Alongside Price
Open interest in $PENDLE stands near $92.13 million per Coinglass data, and unlike a sudden spike, this has been a steady, multi-week climb that has tracked the price higher since early August.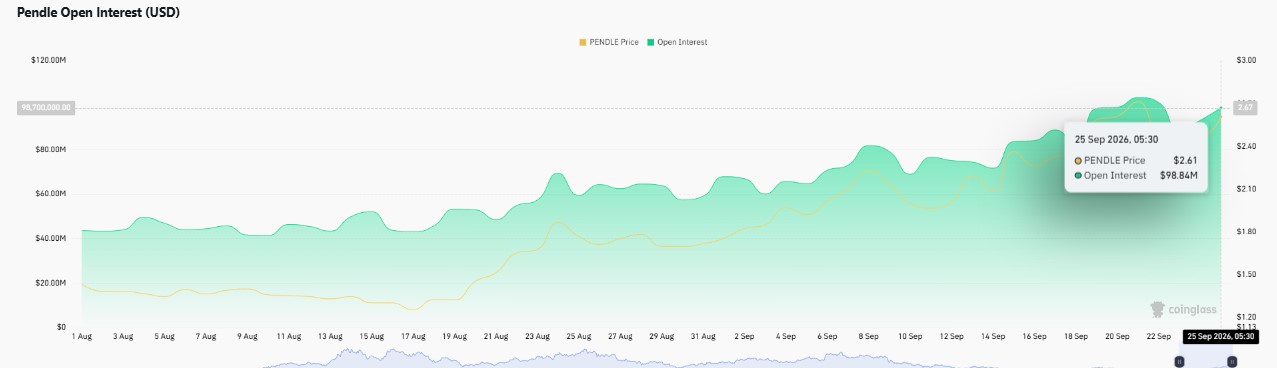
That kind of gradual buildup, rather than a single sharp jump, points to positioning that has been accumulating alongside the trend rather than chasing it late.
Pendle Holder Concentration: What the Wallet Data Shows
On-chain data for the token's Ethereum contract shows the top 100 wallets control 90.99% of total supply, with the top 5 holders accounting for 54.60% of market cap and the top 10 for 69.16%.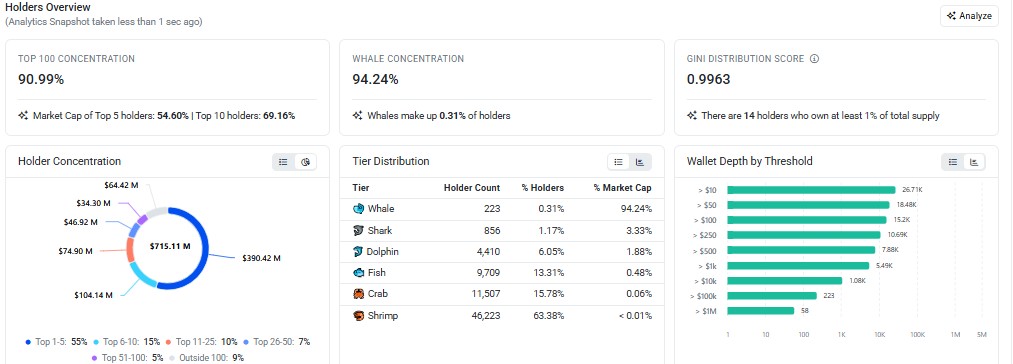
Whale-tier wallets, just 0.31% of all holders, hold 94.24% of supply, and a Gini score of 0.9963 points to a highly concentrated base, with 14 wallets each holding at least 1% of total supply.
The Shrimp tier, over 46,200 holders, together controls less than 0.01% of market cap.
Pendle Daily Chart: Reading the Breakout Structure
The daily PENDLE/USDC chart on Coinbase, per TradingView data, shows a long consolidation phase where price stayed pinned below its 200-day EMA for months.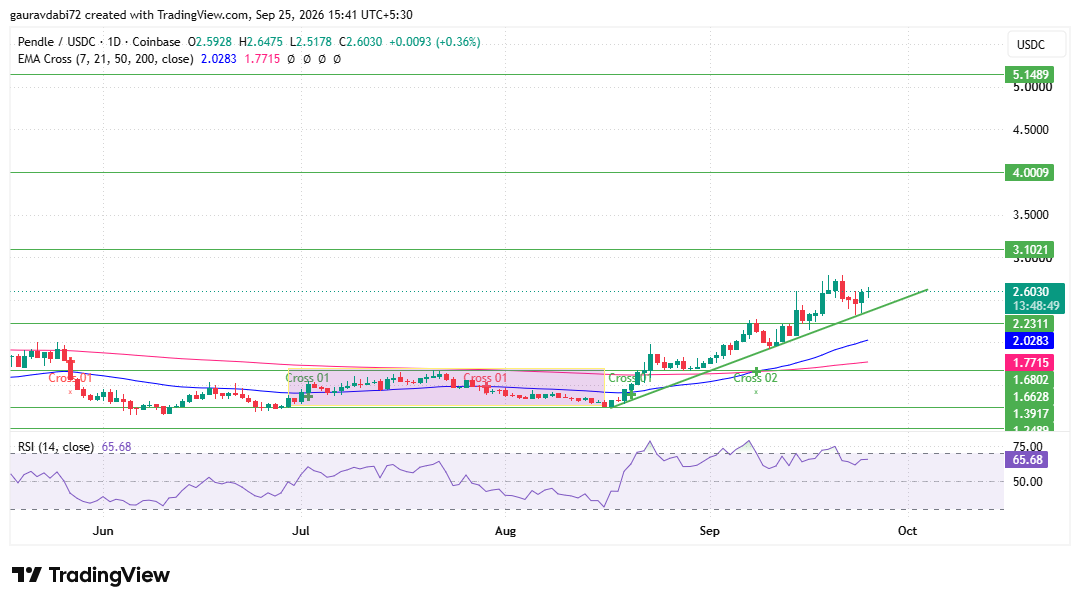
After that stretch, $PENDLE broke upside and reclaimed the 200-day EMA, and it is now building a clean higher low formation inside an ascending channel.
RSI sits at 65.68, firm but not yet stretched into overbought territory, leaving room for the move to extend before it gets crowded.
If the channel holds and the price breaks above it with follow-through, resistance sits at 3.1021, then 4.0009, and a stretch zone near 5.1489 further out.
Support below runs deep, with cushions at 2.2311, 1.6802, and 1.2488.
Pendle Long-Term Outlook: Is the $10 Zone in Play?
Zooming out, the broader structure still favors buyers as long as $PENDLE holds above its 200-day EMA and the ascending channel stays intact.
The nearer sequence, 3.1021 then 4.0009 then the 5.1489 stretch zone, remains the more realistic path for now.
But a sustained break and acceptance above 5.15 to 5.50 would open the door to a much bigger move.
In a genuinely risk-on market, paired with a recovery in Pendle's TVL and rising fee revenue, the next structural zone sits closer to $8 to $10, which would also mean reclaiming ground above the token's prior all-time high near $7.50.
That is roughly a 3.8x move from current levels and sits firmly in bull-case territory, not the base case, needing the channel to hold, a confirmed break above 5.15, and broader market tailwinds.
Until then, the 3.1021 to 5.1489 range stays the more grounded zone to watch.
Pendle Price Outlook: What Could Happen Next
Scenario | Trigger | Key Levels |
Bullish | Holds the ascending channel and clears 3.1021 with volume | Opens the path toward 4.0009 and 5.1489 |
Range-bound | Fails to clear 3.1021 but holds above 2.2311 | Consolidation between 2.2311 and 3.1021 |
Bearish | Loses the 2.2311 support cleanly | Slide toward the 1.6802 and 1.2488 cushions. |
Key Risks to Watch
A break below the ascending channel would undercut the higher-low structure that has defined this rally and could trigger a faster move back toward the deeper support zones.
Whale-tier wallets controlling over 94% of supply is another factor, since a handful of large holders could move price sharply if they choose to take profit into strength.
The token remains well below its one-year price mark too, a reminder that $PENDLE has a history of giving back gains quickly once momentum fades.
Analyst Desk View
As per the CoinGabbar analyst desk, reclaiming the 200-day EMA after such a long stretch below it, paired with steadily rising open interest and long-skewed positioning across exchanges, points to a genuine shift in trend rather than a short-lived bounce.
That said, the channel structure still needs to hold on a retest before the move toward 3.1021 and beyond can be treated as confirmed.
Conclusion
Pendle's breakout from a months-long range, backed by rising open interest and firmly long-skewed derivatives positioning, gives this Pendle price prediction a constructive lean heading into the next few weeks. Whether the higher-low channel holds on its next test will likely decide if $PENDLE pushes toward 3.1021 or slips back into consolidation.
Disclaimer: This article is for informational purposes only and should not be considered financial or investment advice. Cryptocurrency markets are highly volatile, and prices can change rapidly. Readers should conduct their own research and consult a qualified financial advisor before making any investment decisions.

















