Aptos Price Prediction: Is APT Ready for a Breakout?


Aptos has had a rough year, and the chart doesn't hide it, but something's shifting right now.
APT just pushed back up to the top of the descending channel that's boxed it in for weeks, and it's doing so on a real jump in volume.
The question behind this Aptos price prediction is whether that's enough to actually flip the trend or whether this is just the latest bounce that fades before it goes anywhere.
Why Is Aptos Price Moving Today?
APT is trading at $0.6006, up 3.52% over the last 24 hours. What stands out more than the price move itself is the volume behind it—24-hour volume sits at $35.93 million, up 45.19% on the day.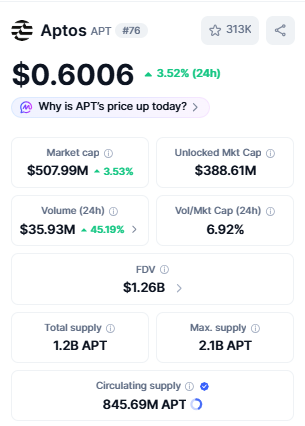
That's a big jump relative to the price gain, which usually means fresh money is stepping in rather than just thin, low-conviction drifting.
Aptos now carries a market cap of $507.99 million, with an unlocked market cap of $388.61 million.
Aptos Launches Confidential Transactions on Mainnet
Thala Labs also had an update today, confirming Confidential APT is now live on the Aptos mainnet. It brings encrypted balances and transfers at the protocol level, giving an opt-in privacy layer for use cases like payroll, treasury management, and B2B settlement.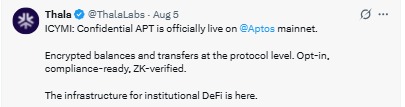
Wallet addresses stay visible, but transaction amounts get encrypted, with zero-knowledge proofs verifying everything under the hood.
It's compliance-friendly privacy rather than full anonymity, fitting the institutional push Aptos has been building toward.
Not a direct price catalyst, but the kind of infrastructure update that adds weight to this Aptos price prediction over time.
What Are Futures Traders Signalling?
Open interest on Aptos futures sits at $77.20 million as of August 6, with APT trading around $0.59 at the time.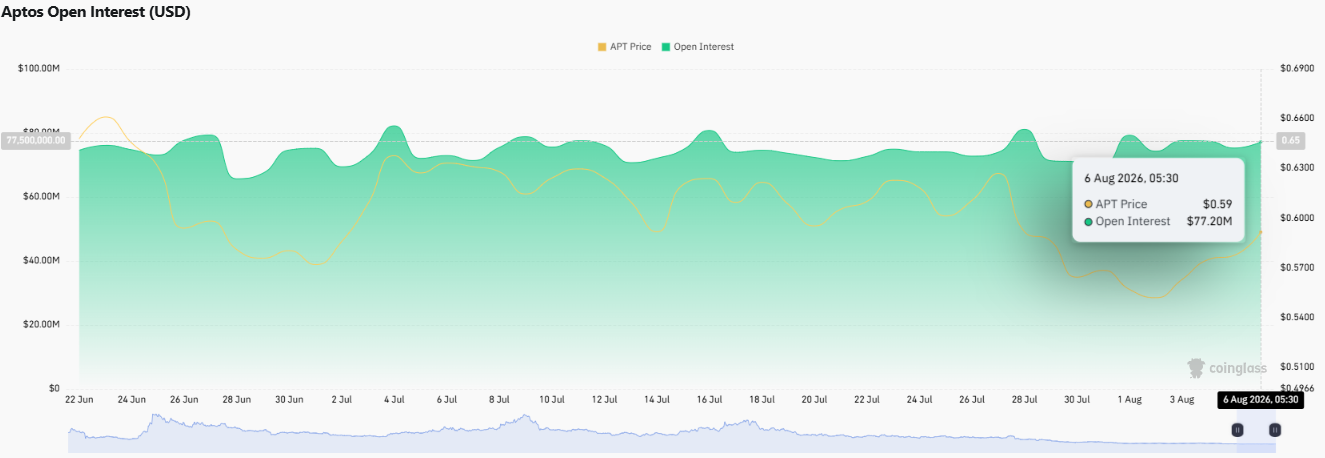
That's within the range OI has held since late June, which has mostly moved between roughly $60 million and $80 million, easing off a bit from the highs seen in early July.
Liquidations lean heavily toward shorts getting caught out. Over the past 24 hours, $91.59K was liquidated in total, and $81.30K of that came from short positions—longs only accounted for $10.28K.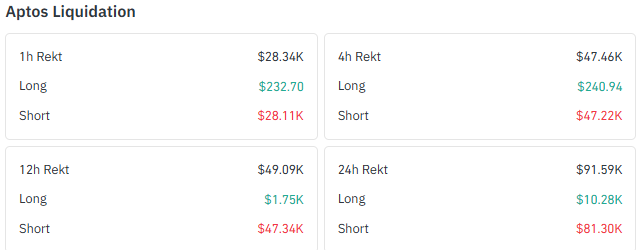
That pattern holds across the shorter windows too, with shorts taking the bulk of the pain in the 1-hour, 4-hour, and 12-hour windows as the price pushed higher.
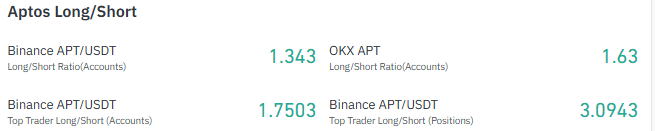
Positioning data backs this up: the APT long/short ratio sits at 1.34 on Binance and 1.63 on OKX, and Binance's top traders are even more skewed long, at 1.75 by account and 3.09 by position size.
That's a fairly crowded long trade, which cuts both ways; it can keep fueling a squeeze higher or unwind quickly if the breakout stalls.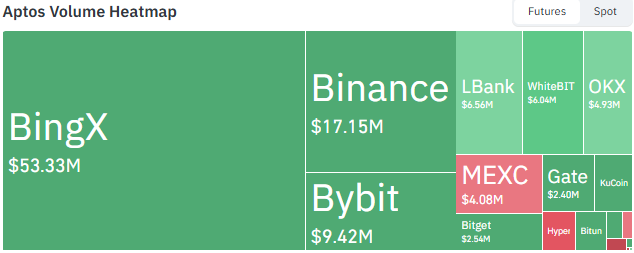
On the volume side, BingX is doing most of the heavy lifting at $53.33 million, well ahead of Binance's $17.15 million and Bybit's $9.42 million.
Data source: coinglass
Has Aptos Finally Reached a Breakout Point?
APT has been grinding lower inside the TradingView daily chart in a clean descending channel for weeks, with sellers shutting down every recovery attempt at the top of it.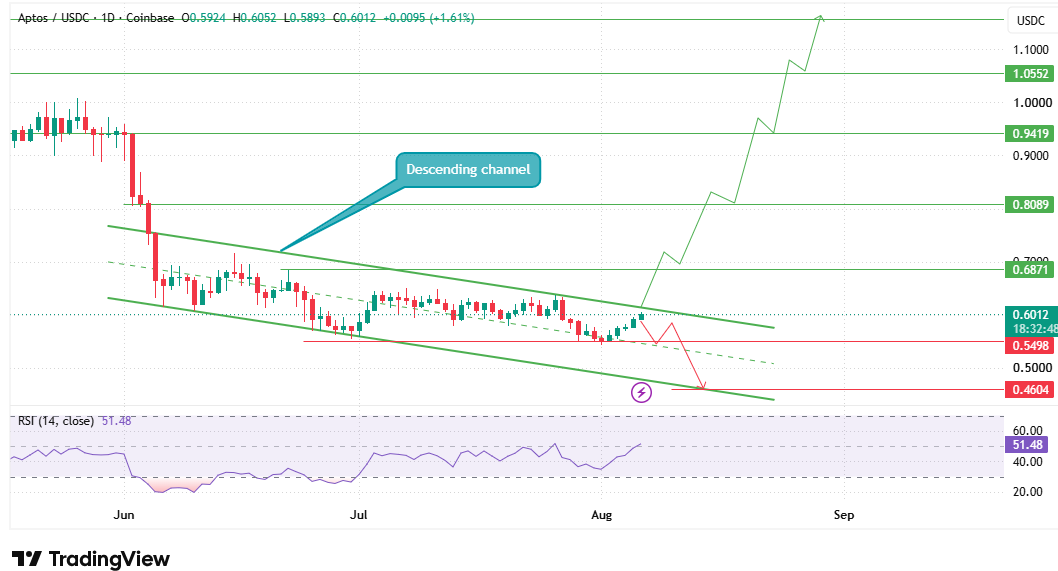
That's the fight happening right now; the price has climbed back up to test that channel resistance near $0.60, and this is the level that decides where APT goes next.
A daily close above this zone would be the first real crack in a downtrend that's held since the decline started.
Get that, plus buyers turning old resistance into support on a retest, and the structure genuinely starts to change.
That said, nothing's confirmed yet without a decisive close and real buying behind it; APT is still one rejection away from slipping back inside the channel like it has before.
Key Support and Resistance Levels to Watch
Get through $0.60 with follow-through, and the path opens toward $0.6871, then $0.8089, $0.9419, and eventually $1.0552 further out.
None of those are likely to hit in a straight line; each is a natural spot for traders to take profit along the way.
Lose the $0.60 zone again, though, and APT likely drifts back toward $0.5498, with $0.4604 as the next floor beneath that.
Momentum is leaning the right way, at least. The daily RSI has climbed to 51.48, just above the neutral 50 mark, enough to say buyers are trying to take control, but not enough yet to call this a confirmed reversal.
A sustained push higher on the RSI would give this Aptos price prediction a lot more weight.
Aptos Price Prediction: Bull, Neutral and Bear Scenarios
Scenario | Key Levels |
Bull Case | It holds above $0.60 and clears $0.6871, then $0.8089, $0.9419, and $1.0552 open up |
Neutral Case | Stuck between $0.5498 and $0.6871 while the market waits for a confirmed close |
Bear Case | Drops back under $0.60, slips inside the old channel, $0.5498 then $0.4604 come under pressure |
Price Performance Reflects a Long-Term Recovery Challenge
In the short term, APT's actually been holding up, up 3.33% over the last 24 hours and 6.30% across the past week, right as buyers try to push through that descending channel resistance.
But zoom out even a little and the picture gets a lot less flattering. The token's still down 5.01% over the past month, and the damage gets worse the further back you go: a 41.59% drop over 90 days and a 47.35% drop over six months.
Year-to-date, APT's down 63.92%, and over the full year it's off 86.01%. So while this week looks encouraging, it's worth being honest about what it actually is: an attempt to claw back from a deep, prolonged downtrend, not a continuation of anything bullish that was already in motion.
With 845.69 million APT in circulation against a 2.1 billion max supply, the real question isn't whether the setup looks better right now it's whether this recovery has the legs to hold up over the coming weeks or whether it fades the way earlier bounces have.
What We're Watching Next
As per the Coingabbar analyst, the bounce off the channel floor is worth watching, but it's still early days.
A confirmed daily close above $0.60, followed by a successful retest, would be the clearest sign that buyers are actually taking control rather than just testing the water.
Until then, this stays a recovery attempt inside a much bigger downtrend rather than a confirmed reversal.
The crowded long positioning in the futures market is worth keeping an eye on too; it's supportive while the breakout is working, but it could accelerate a drop if the price fails to hold above $0.60.
Disclaimer: This article is for informational purposes only and should not be considered financial or investment advice. Cryptocurrency markets are highly volatile, and prices can change rapidly. Readers should conduct their own research and consult a licensed financial advisor before making any investment decisions.


















