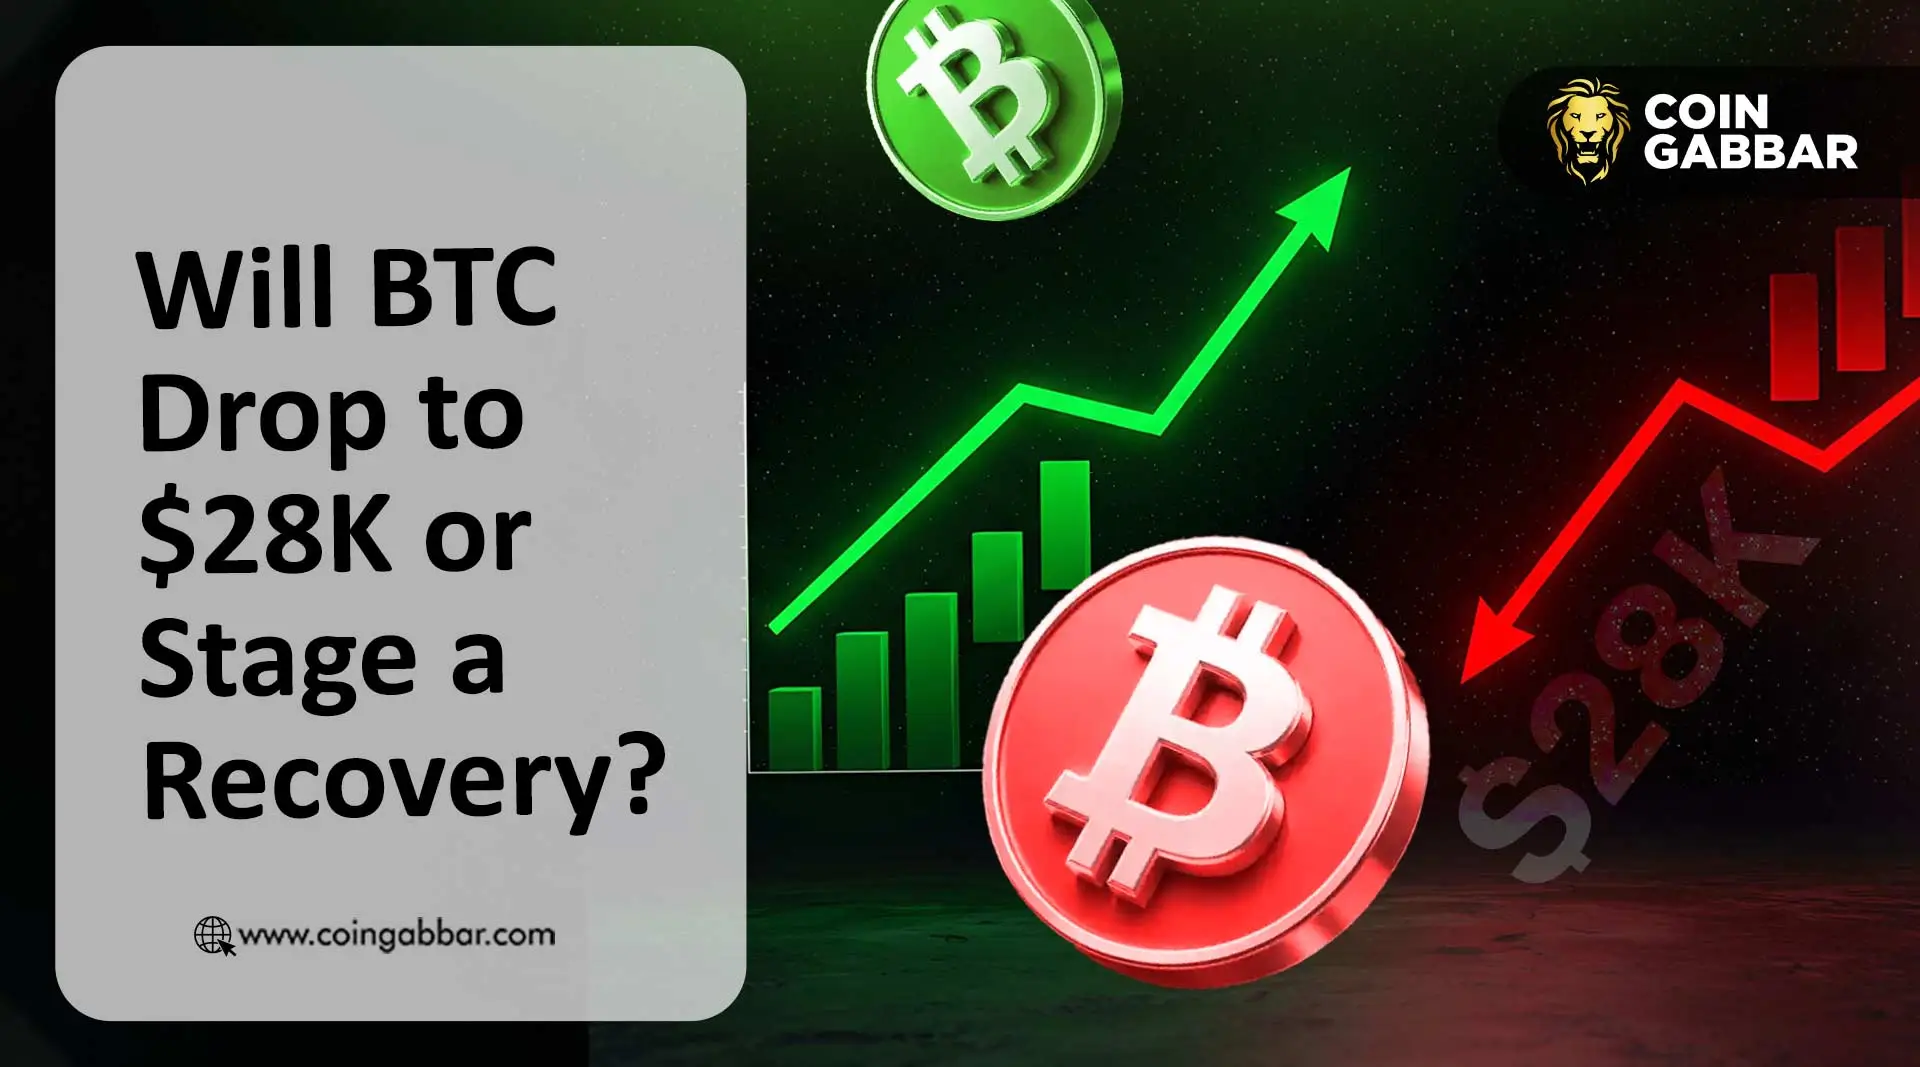
Bitcoin Price Crash 2026: Will BTC Drop to $28,000 or Recover?
Bitcoin is bleeding. The ongoing Bitcoin price crash has pushed BTC down to around $63,000, more than 50% below its all-time high of $126,000.
The Fear and Greed Index sits at just 12, deep in extreme fear territory, and over $633 million in leveraged positions were wiped out in a single 24-hour window.
he market is hurting, and traders want to know one thing: Is this the bottom, or is there more downside coming?
Why Is Bitcoin Crashing Right Now?
The selling pressure is coming from multiple directions at once. Geopolitical tensions in the Middle East have pushed investors away from risk assets broadly.
Large holders appear to be taking profits after the rally to all-time highs. And with global financial markets on edge, the appetite for speculative bets has dried up fast.
CoinGlass data tells the story clearly. More than 161,000 traders were liquidated in 24 hours. Long positions took the brunt of it, accounting for $464.74 million of the total damage.
One Bitcoin-USD trade on Hyperliquid alone saw a $5.29 million wipeout. That kind of leverage flush tends to accelerate moves on the way down.
Why Is Crypto Crashing Across the Board?
This is not a BTC-only problem. Ethereum dropped 4.2% to $1,730. BNB fell 3.3% to $596. Monero slid 8% to $334. The total crypto market cap shed 2.5% in 24 hours to roughly $2.26 trillion.
When everything falls together like this, it usually points to macro fear rather than any coin-specific issue.
Why Bitcoin Price Is Crashing: What the Charts Show
Analyst Ali Charts flagged on the weekly chart that BTC is now testing a long-term ascending trendline that has held through every major correction of the current cycle.
Losing that line could open the door to the $34,000 to $19,000 support zone.
On the daily chart, BTC has broken down from a rising channel. The RSI is sitting near 17, which is heavily oversold. A bounce is possible from here, but oversold readings alone do not stop a trend.
The measured move from the breakdown targets the $50,000 to $51,000 range, which lines up with a prior swing low and major horizontal support.
Any short-term relief rally is likely to face stiff resistance between $67,000 and $72,000.
Why Is Bitcoin Falling? History Has Seen This Before
Past bear markets offer a sobering reference point. From 2018 to 2020, the BTC price collapsed 80% from $19,118 to $3,800. In 2022, it fell 78% from $69,000 to $15,000.
If this cycle follows the same playbook from a $126,000 peak, a 75% to 77% decline puts the floor somewhere around $28,000 to $30,000.
That said, this cycle has a different structural backdrop. Spot BTC ETFs are live, institutional involvement is deeper, and on-chain infrastructure is more mature. Those factors may compress how far the Bitcoin price crash ultimately goes.
Why did Bitcoin drop, and will Bitcoin recover?
The bear case is real. But so is the bull case.
If buyers defend current levels and BTC manages to reclaim $72,000 with conviction, the current breakdown could end up being a deep correction rather than the start of a prolonged bear market.
Long-term holders loading up near these levels would be a positive sign to watch.
Until that reclaim happens, the path of least resistance remains lower. Key levels are $50,000 to $51,000 as the next significant downside target and $28,000 to $30,000 as the worst-case bear market floor based on historical drawdown data.
Stay cautious. Manage size. The next few weeks will likely answer a lot of questions.
Disclaimer: This article is for informational purposes only and does not constitute financial or investment advice. Cryptocurrency markets are highly volatile. Always do your own research before making any investment decisions.

1 month ago
I lost over $85,000 to Binary Trading but thanks to RECOVERY DAREK and his team for their professional and Ethical service rendered in recovering all of my money from this scammers. If you need help to recover your money back Information is Key. You can also contact them on recoverydarek (@) Gmail dot Com .


.webp)