Bitcoin Price Forecast: Where BTC Heads Next After This Week's Chaos


Bitcoin Price Forecast: Key Takeaways
BTC trades near $64,112, holding above its roughly $62,000 production cost floor
Binance's realized price near $60,900 keeps most exchange holders in profit
Strategy remains underwater at a $75,476 average cost basis despite this week's loss sale
Public companies bought 110,000 coins in Q2 2026, pushing corporate holdings past 6% of total supply
Price needs to clear $64,500-$65,500 resistance for the current breakout to continue
The coin is trading near $64,112 after a rough stretch that saw more than 53,000 traders get liquidated in a single day.
Bitcoin Price Today: BTC Holds Near $64K Despite Choppy Volume
BTC sits at $64,112.3, up a small 0.03% on the day. This snapshot shows futures volume over 24 hours reached $39.38 billion, while open interest holds near $47.18 billion.
Spot volume came in lighter, at $3.26 billion. Options open interest slipped 5.05% to $28.27 billion, showing some traders are pulling back from bigger bets for now.
Bitcoin News Today: 53,000 Traders Liquidated in $133M Shakeout
CoinGlass data shows 53,157 traders got liquidated in the last 24 hours. Total liquidations reached $133.26 million.
The biggest single order hit on Binance, a BTC/USDT position worth $3.21 million.
Despite the wipeout, exchanges still saw a net inflow of $90.44 million the day before, a sign some traders are still positioning for more action.
Long and short ratios on Binance show longs slightly ahead, at 1.2696 for accounts.
Top traders on Binance lean even more bullish, with a long/short ratio of 1.3409 by position size, a detail worth watching in any BTC news prediction update.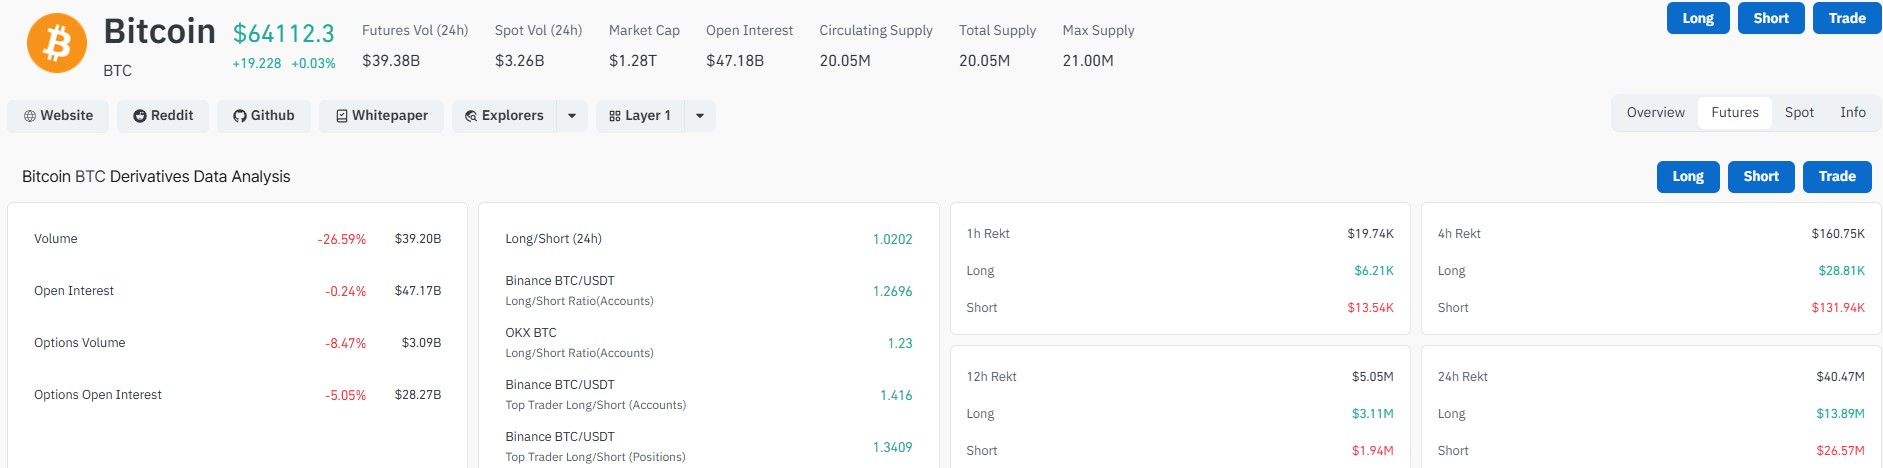
BTC Price Forecast: $BTC Holds Above Its $62K Production Cost Floor
Yes. Historical data shows BTC rarely trades below its production cost since 2020. That cost currently sits around $62,000.
Every time price has dipped under that level, it has marked a buying opportunity looking back at past cycles. BTC's current price near $64,112 keeps the bitcoin price outlook just above that floor.
BTC News: Binance Still Dominates Exchange Bitcoin Supply at 29.75%
Binance remains the largest centralized exchange by supply, holding 29.75% of all exchange-held bitcoin. Bitfinex follows at 16.75%, and Gemini holds 8.66%.
Exchange | BTC Supply Share |
Binance | 29.75% |
Bitfinex | 16.75% |
Gemini | 8.66% |
Kraken | 8.46% |
OKX | 6.25% |
Upbit | 5.88% |
Robinhood | 4.19% |
bitFlyer | 3.18% |
Binance's reserve realized price sits around $60,900. That means the average Binance BTC holder is not underwater at current prices, unlike some large corporate buyers.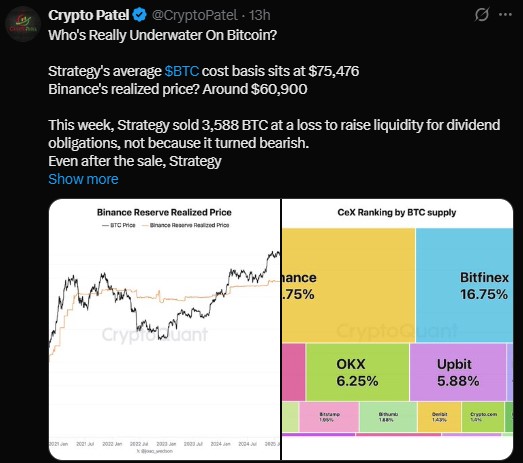
Strategy Still Underwater on Bitcoin at $75,476 Average Cost Basis
Strategy's average cost basis sits at $75,476, well above the current market price.
This week, the firm sold 3,588 coins at a loss to cover dividend payments, not because of a bearish shift in view.
Even after that sale, Strategy holds 843,775 coins. That is still more than the 656,561 coins sitting on Binance.
The gap tells a simple story. Price matters, but cost basis matters more when judging who is actually losing money on paper.
Bitcoin Price Prediction 2026: Firms Add 110,000 BTC in Q2 Buying Spree
Public companies added 110,000 coins in Q2 2026 alone. That is about 1.8 times more than the previous two quarters combined.
Quarter | Net Added |
Q4 '24 | 234,000 |
Q1 '25 | 107,000 |
Q2 '25 | 140,000 |
Q3 '25 | 190,000 |
Q4 '25 | 57,000 |
Q1 '26 | 65,000 |
Q2 '26 | 110,000 |
Corporate treasuries now hold more than 1.26 million coins combined. That works out to over 6% of Bitcoin's total supply.
This bitcoin price forecast has to account for that steady institutional demand, since fewer coins are floating around for retail buyers to trade.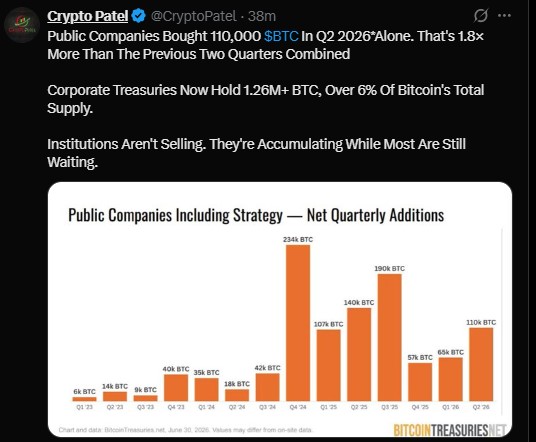
Bitcoin (BTC) Price Forecast: Bulls Eye Inverse Head-and-Shoulders Breakout
BTC has broken out of its daily downtrend for the first time in two months, based on recent price action.
For that move to hold, price needs to clear the $64,500-$65,500 resistance zone and stay above it.
Chart watchers also point to a bullish inverse head-and-shoulders pattern forming on the daily.
If confirmed, that pattern often points to more upside, though nothing is guaranteed in this market.
Some traders following an eight-month dump and accumulation cycle expect price to test the $69,000 fair value gap next. Under that view, a drop below $50,000 could follow if the pattern repeats.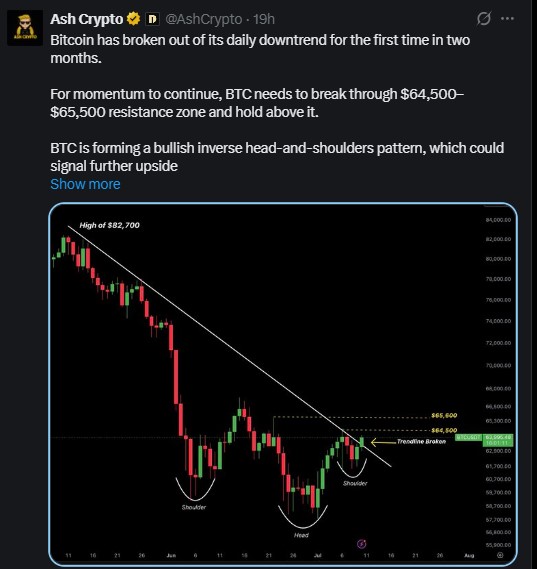
Others are watching for a July-August summer rally instead. Both scenarios remain open until price confirms a direction.
Disclaimer: This article is for informational purposes only and does not constitute financial, investment, or trading advice. Cryptocurrency markets are highly volatile and carry significant risk. Past performance does not guarantee future results. Always do your own research and consult a licensed financial advisor before making investment decisions.

















