BNB Price Prediction Today : Breakout Or Fakeout?


$BNB is trading around $577.20 right now, cooling off after a sharp spike into resistance earlier and currently pulling back from those highs on the hourly chart.
This pullback comes right after $BNB tested a key resistance zone following yesterday's tokenized stock news on BNB Chain, adding an important angle to this BNB price prediction.
This BNB price prediction today looks at both the chart structure and the news together to figure out what could move the price next.
$BNB Price Right Now
Metric | Value |
$577.20 | |
Market Cap | $76.93B |
Circulating Supply | 134,781,998 BNB |
Total Supply | 134,781,998 BNB |
$BNB News
As per the MSB intel on X yesterday, tokenized shares of South Korean chip giant SK Hynix went live on BNB Chain through Binance, Ondo Finance, and xStocks.
This news appears to be the fundamental spark behind $BNB's sharp spike toward resistance, as fresh real-world usage like this tends to pull in extra buying interest around the network.
Now that the initial excitement has cooled a bit, $BNB is pulling back from those highs, but the underlying story still matters for any longer-term $BNB price prediction, since the chain keeps adding real-world use cases beyond just crypto trading.
$BNB Liquidation Overview
As per CoinGlass liquidation data, longs are getting hit the hardest across the 1H and 4H windows, while the 12H and 24H windows show a much more mixed picture, with shorts taking a heavier share of the damage on the 24H timeframe. 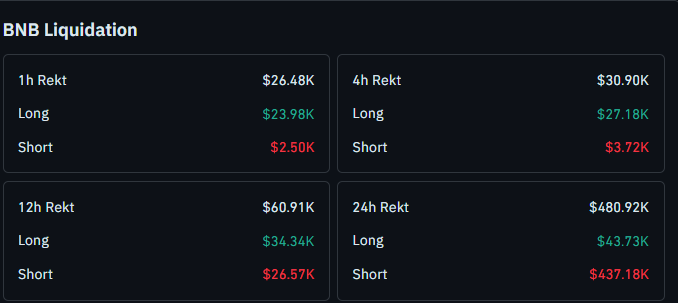
Source: Liquidation data by CoinGlass
This kind of mixed liquidation pattern lines up well with the choppy price action, where BNB spiked into resistance, caught some longs offside on the smaller timeframes, and then triggered a bigger short squeeze earlier in the day before rolling over again.
BNB Price Prediction: Technical Outlook
On the 1-hour chart, $BNB was earlier following a descending trendline, creating a series of lower lows with each tap.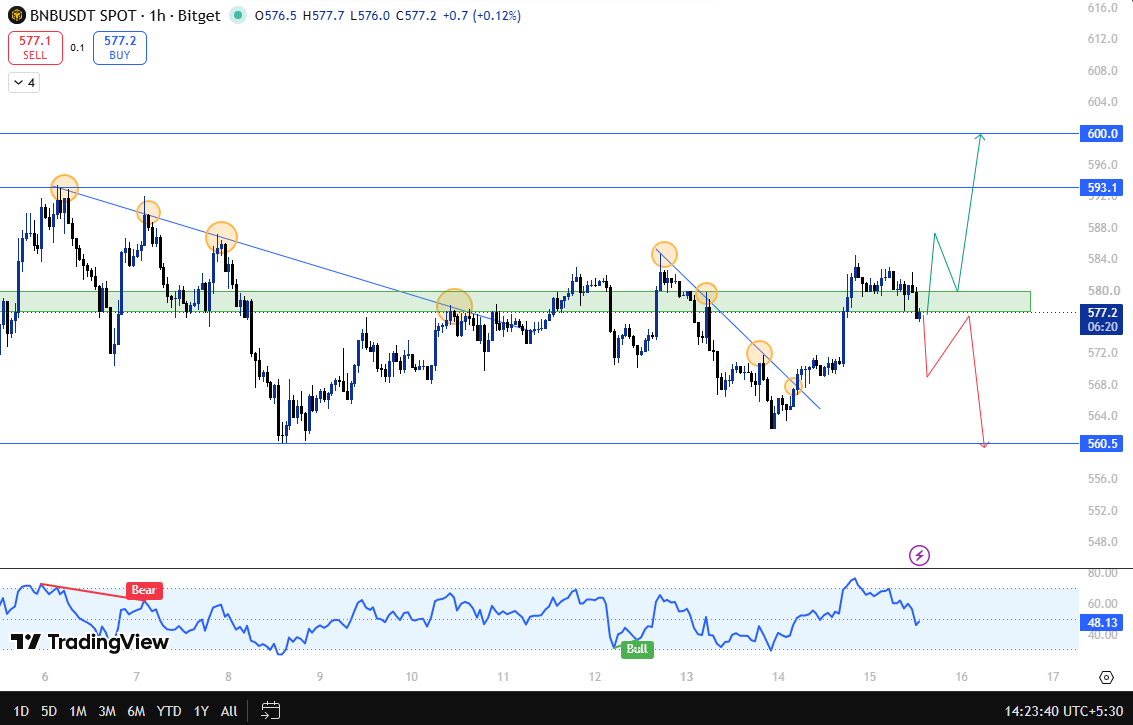
After the third tap on this trendline, price finally sustained itself and gave a clean breakout.
From there, $BNB should have continued pushing higher, but instead it formed another lower low, this time along a fresh, smaller descending trendline.
Once the second trendline broke, $BNB saw a sharp spike into a major resistance zone that had previously acted as a flip level.
The move was driven by the combined impact of the SK Hynix news and bullish expectations surrounding the upcoming U.S. CPI data, leading to increased buying pressure.and then,$BNB got rejected from flip zone and is now moving back down from there.
If $BNB manages to close above $585 again and holds with strength, the next target comes in at $593, and beyond that, $600 opens up as the next level to watch.
On the other hand, if this pullback continues and price breaks down further, support sits at $580, and if that fails to hold as well, the next support comes in near $560.50.
Support and Resistance Levels
Level Type | Price |
Resistance | $600.00 |
Resistance | $593.00 |
Flip Zone / Immediate Resistance | $580.00 - $585.00 |
Current Price | $577.20 |
Support | $560.50 |
Risk and Reward: The Honest Version
Factor | Bull Case | Bear Case |
$580-$585 Flip Zone | Reclaims with strength, opens path to $593 and $600 | Rejects again, price slides back toward $560.50 |
$560.50 Support | Holds, keeps the recovery attempt alive | Breaks down, opening room for deeper downside |
The analysis above combines short-term chart structure with the latest BNB news and should not be treated as a guarantee of future performance.
Invalidation Level
This entire recovery attempt stays valid as long as BNB holds above $560.50.
A confirmed break and close below this level would invalidate the current bullish structure, and in that case BNB would likely need to build a fresh base before any real recovery attempt becomes realistic again.
Expert View
Traders watching $BNB on the lower timeframe are treating this resistance rejection as a meaningful shift, especially after price broke a fresh descending trendline only to spike straight into a flip zone and get pushed back.
With the SK Hynix tokenization news now a day old, its immediate impact seems to be fading, and the chart is taking over as the bigger driver of this BNB price prediction for now.
Most agree that reclaiming the $580 to $585 zone with strength would be the real signal to watch, opening the door toward $593 and $600, while continued rejection here keeps $560.50 in focus as the next key support.
Keeping an eye on the fear and greed index can also help gauge sentiment around this kind of short-term setup.
Disclaimer: This article is for informational purposes only and should not be considered financial advice. Cryptocurrency markets are highly volatile, and price predictions are not guaranteed. Please do your own research before making any investment decisions.
Also read:

















