Bonk Price Prediction: One Pattern, Two Outcomes, Zero Room for Error


Eighteen months ago, BONK was a joke token that Solana developers airdropped to themselves over Christmas. Nobody was writing price predictions. Nobody was watching the chart.That changed.
Right now, a pattern has formed on the BONK 1D chart that veteran traders recognize immediately. The kind that either makes a position or destroys it. The RSI is whispering caution, a key resistance already rejected price hard in mid-May, and whales have been unusually quiet.
So what's the Bonk price prediction for 2026? The chart has two very clear answers. And the market is about to pick one.
BONK Fundamentals Every Trader Should Know
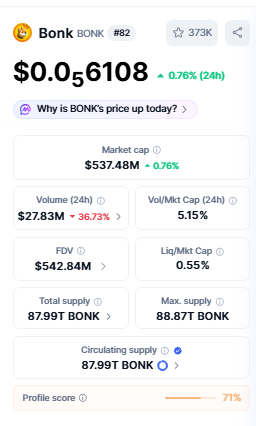
Source: Data by Coinmarketcap
Volume over the past 24 hours came in at $27.83M, which is about 5.15% of market cap.
That's a decent activity ratio, not dead, but not exactly explosive either. FDV of $542.84M suggests that nearly all tokens are already in circulation, which removes a major bearish overhang.
No huge vesting cliffs to worry about.
What's Happening in the Market Right Now
Bitcoin pushed to a May high near $82,850, its strongest level since January, and that brief surge lit up alt sentiment across the board. Bonk caught a piece of that energy in mid-May.
But BTC couldn't hold the level; it slipped back toward $77,000, and meme coin momentum faded with it.
Sellers stepped in at a key resistance area and rejected the move sharply, which is exactly the pattern showing up on the 1D chart right now.
A bearish flag has formed after that rejection, and the price is consolidating near $0.00000610.
The broader market is dealing with some mixed signals.
ETF inflows into Bitcoin have been steady, and crypto regulatory clarity is slowly improving across the US and EU, which is a net positive for risk assets like meme coins.
But dominance is still tilted toward Bitcoin and a handful of large caps, which means speculative capital isn't rotating into memes the way it did in late 2024. Not yet, at least.
Latest Bonk News and What Traders Are Watching
The most talked-about thing in BONK circles right now is a price targets post from crypto analyst Celal Kucuker (@CelalKucuker), shared on May 16.
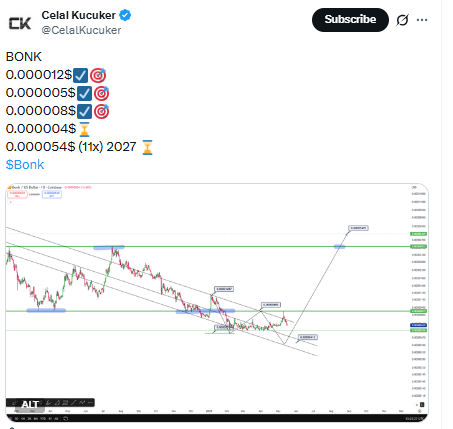
He listed $0.000012, $0.000005, $0.000008, $0.000004, and a high-conviction 11x target of $0.000054 for 2027.
That last number is aggressive, no doubt. But the fact that a publicly followed analyst is mapping out those levels is pulling attention back to BONK.
What the Chart Is Actually Telling Us
When we pulled up the BONK/USDT 1D chart on Binance, the first thing that stood out was that bearish flag sitting right in the middle of price action.
BONK has been taking support from rising trendline since february. Currently, the price has been rejected from trendline. But the bearish flag sitting right above it changes everything. If price breaks the trendline and the flag fails at the same time, that's not a regular breakdown. That's two structures collapsing together, and the chart gets very ugly, very fast.
Open at 0.00000602, high at 0.00000616, low at 0.00000600, that 1.50% daily candle looks decent on the surface, but the flag structure overhead is still intact.
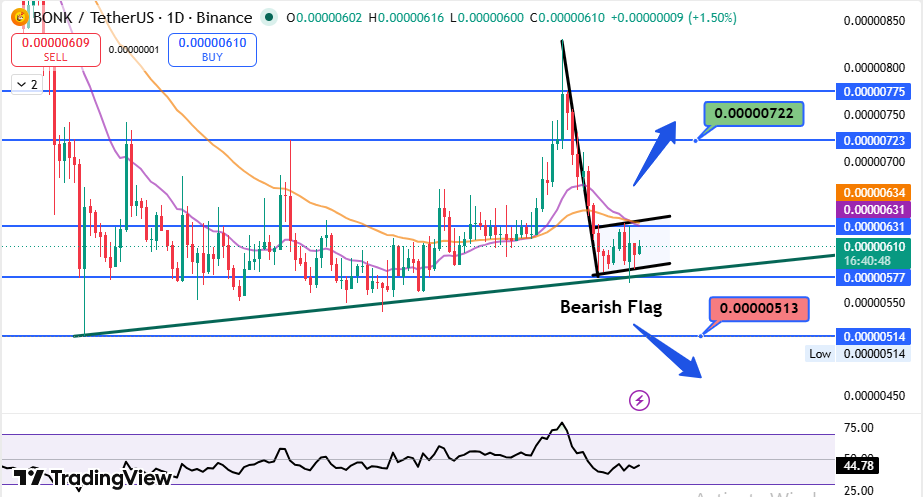
RSI is at 44.78. That's in light bearish zone. It's not screaming oversold, it's whispering caution.
RSI hovered in this range on BONK's 1D chart, price drifted sideways for about two weeks before picking a direction. That's the kind of zone where you want to wait for confirmation rather than front-run the move.
Price is trading right at the 0.00000610 level, which lines up with a short-term support zone. The 20 EMA and 50 EMA crossing in a way that could turn either direction depending on the next 2 to 3 daily closes.
There's no clean EMA support stacking beneath price right now. That matters.
Support and Resistance Levels
Support zones: $0.00000577 and the broader trend line around $0.00000513 if the bearish flag breaks down.
Resistance zones: $0.00000631 to $0.00000634 is the immediate ceiling. Above that, $0.00000722 is the bullish target.
Short-Term Bonk Price Prediction for 2026
If the bearish flag breaks to the upside and sustain above $0.00000631 to $0.00000634 resistance with volume, the short-term target range is $0.00000722 to $0.00000747.
If the flag breaks downward and the trend line gives way, price could fall toward $0.00000513 to $0.00000514. That's the low zone marked on the chart and it represents about a 16% drop from here.
The honest answer? We're in a decision zone.
And that raises a bigger question: whether the broader crypto market rotation into meme coins has actually started, or if it's still weeks away.
Long-Term Bonk Price Forecast for 2026 and Beyond
The 11x target of $0.000054 that Celal Kucuker posted isn't impossible for a meme coin with $537M market cap and full circulation.
But it requires either a macro bull run of significant scale or a specific BONK narrative that captures retail attention the way BONK did in early 2024.
Bonk price prediction targets in the $0.000015 to $0.000025 range are realistic without needing a miraculous catalyst. That's 2x to 4x from current levels.
A Bonk price prediction for 2026 at the bearish end sits in the $0.000003 to $0.000006 range if macro conditions deteriorate and meme coin interest collapses.
This is the scenario where Bitcoin dominance keeps climbing and speculative capital stays locked out of smaller tokens.
Bullish Factors
The token supply situation is clean. Almost the entire supply is already circulating, so there's no silent inflation risk coming from team unlocks.
Bitcoin is trading above key macro levels, and history shows that when BTC holds strength for more than two consecutive weeks, meme coin volume tends to follow.
Bearish Factors
The bearish flag on the 1D chart is real and it's visible. If this pattern completes to the downside, the measured move takes price toward $0.00000513.
RSI is sitting at 44.78. It's not in oversold territory yet, which means there's still room to drop before buyers step in with conviction.
Risks and Volatility Warning
Meme coins don't move slowly. That's the thing most newcomers underestimate. A 30% swing in either direction within 48 hours is normal for BONK.
It's happened multiple times this year alone. The bearish flag pattern, the soft RSI, and the harsh resistance rejection from mid-May are all signals that deserve respect.
And this isn't about being bearish for the sake of it. It's about sizing positions to survive the volatile moves while staying in the game for the big one.
Is Bonk a Good Investment Right Now?
That depends on your time horizon and your stomach for volatility. If you're looking for a quick 10% trade, the current bearish flag is not the ideal entry.
Wait for confirmation above $0.00000634 or a clean breakdown to $0.00000513 and a bounce.
If you're building a long-term meme coin position for 2026 and beyond, the fundamentals here aren't bad. Full circulation, reasonable market cap, active community, and analysts with specific targets.
But this is not financial advice. Position sizing matters more than entry timing in meme coins.
Conclusion
Bonk Price Prediction 2026 comes down to one chart pattern and two possible outcomes. The bearish flag breaks up and price targets $0.00000722 to $0.00000747.
it breaks down, and the trend line gives way toward $0.00000513. RSI at 44.78 doesn't give bulls a strong advantage yet, but it's not a full shutdown either.
Smart money is watching this level quietly. The 24-hour liquidation data already shows longs got shaken out. If BONK holds support and consolidates tightly, the setup gets more interesting by the day.
This is the kind of chart where doing nothing is a position too. Wait for the break. Trade the confirmation. The Bonk price forecast for 2026 has two very clear paths, and the market is about to choose one.
DISCLAIMER: This article is for educational purposes only and does not constitute financial advice. Crypto markets are highly volatile. Before making any investment decisions, consult your investment advisor.












.webp)




