Chainlink Price Prediction 2028: Can LINK Hit $100?


LINK is trading around $7.89 right now, sitting right back at a support zone that has already proven itself once before. The question for anyone watching this chart is whether history is about to repeat.
The monthly chart is where the real story is playing out, and it is worth going through that structure properly before making any Chainlink price prediction 2028 call.
$LINK currently ranks 19th among all cryptocurrencies, holding a market cap close to $5.92 billion and a fully diluted value near $7.92 billion, out of a total supply of 1 billion tokens. Around 748 million of those tokens are already in circulation.
Chainlink Price Right Now
Metric | Value |
$7.89 | |
Market Cap | $5.92B |
24H Volume | $191.14M |
Circulating Supply | 748,099,970 LINK |
Total Supply | 1,000,000,000 LINK |
Chainlink Price Prediction 2028: Spot ETF Data Today
As per SoSoValue, LINK Spot ETFs recorded $1.56M in net inflows till 9 July 2026.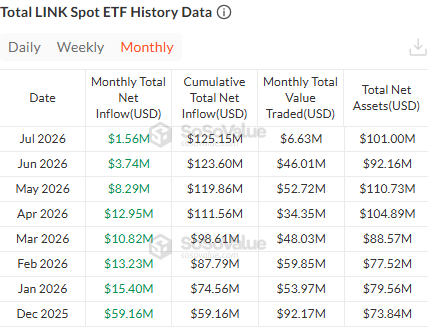
Cumulative net inflow now stands at $125.15M, with monthly trading volume around $6.63M for July and total net assets sitting near $101.00M.
The inflow trend has been cooling off gradually over the past few months, though it has stayed positive throughout.
Mantle Migrates to Chainlink CCIP
Mantle has moved away from its legacy bridge and shifted its full token infrastructure over to Chainlink's Cross-Chain Interoperability Protocol.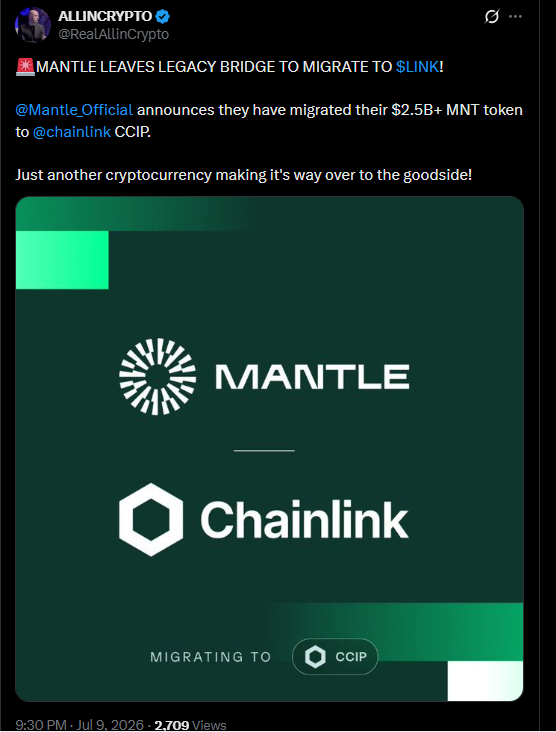
The migration covers more than $2.5 billion worth of MNT tokens, marking one of the larger infrastructure moves onto CCIP this year.
It adds to a growing list of chains and protocols routing their cross-chain activity through Chainlink's network, reinforcing LINK's position as core infrastructure rather than just a token people trade.
Chainlink Price Prediction 2028: Technical Analysis
On the monthly chart, LINK has been moving inside a descending channel for a while, capping every attempt to push higher.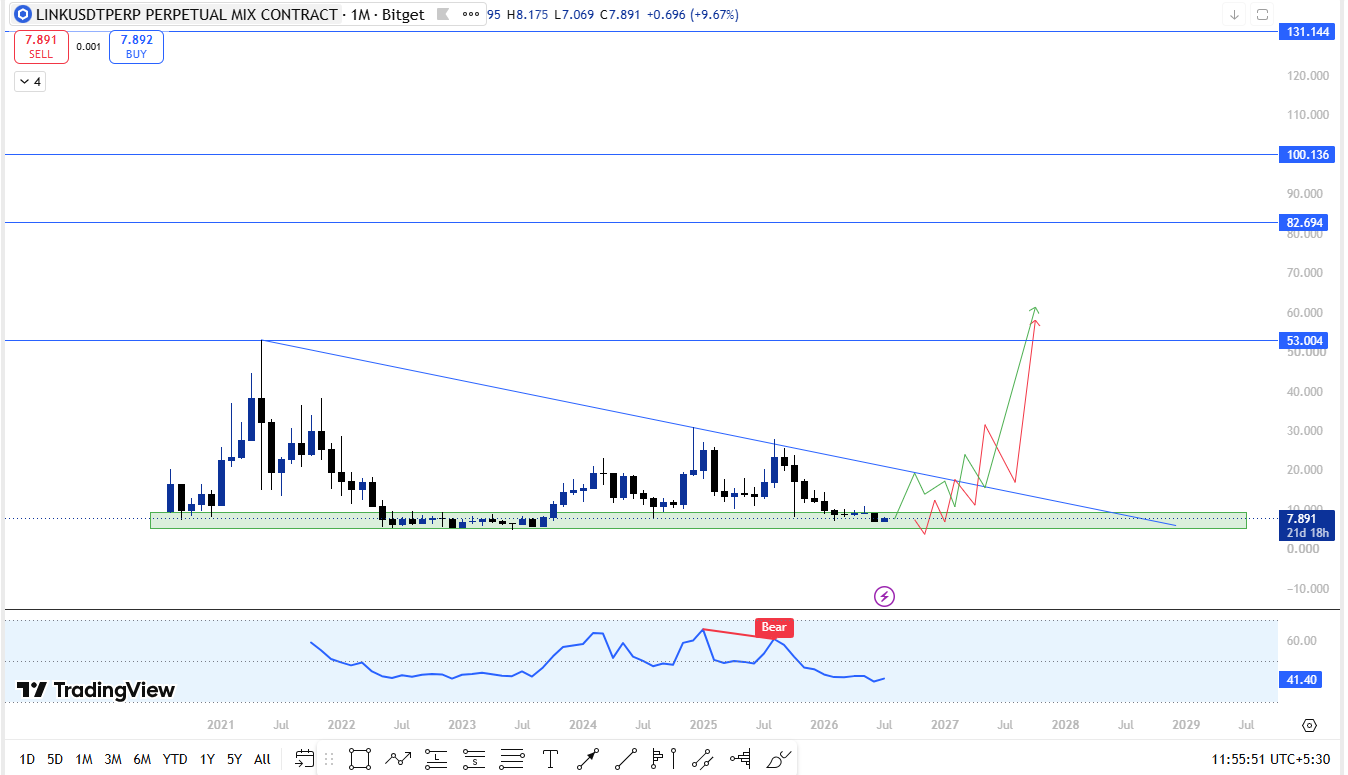
The price is currently back at $7.915, sitting right inside the same support zone between $5.50 and $9.50 that it has tested before.
What makes this zone important is that the last time $LINK held this exact area, it did not just bounce, it rallied almost 500% from here.
That kind of move does not happen from just any level, which is why this support zone carries extra weight on the chart.
Sitting above the current price are four horizontal levels marked out on the chart at $53.004, $82.694, $100.136, and $131.144. (Those levels are Fibonacci extension levels.)
These are not random numbers; they represent the future targets that come into play once LINK manages to break out of this descending channel.
What Holding This Zone Would Mean
As long as LINK continues to defend the $5.50 to $9.50 zone, the setup stays similar to what played out before the last major rally.
A bounce from here followed by a push through the descending trendline would be the first real signal that the channel breakout is underway, opening the path toward those higher targets sitting above.
If that breakout does happen, the move would not need to happen all at once.
Price could work through $53.004 first, then $82.694, before eventually testing $100.136 and $131.144 further out, depending on how much momentum builds once the channel is cleared.
Chainlink Price Prediction 2028: Support and Resistance Levels
The $5.50 to $9.50 zone is the key support area to watch, since it is the same region that triggered the last major rally.
On the resistance side, the descending trendline is the first hurdle, and clearing it is what would open the door toward the $53.004 to $131.144 target range.
Chainlink Price Prediction 2028: Three Scenarios
Bearish Scenario: If the $5.50 to $9.50 support zone fails to hold and the descending channel stays intact, LINK could spend a large part of the next couple of years still trapped inside the channel, keeping 2028 targets in the $8 to $15 range.
Average Scenario: If LINK holds this support and eventually breaks out of the descending channel, a realistic 2028 target lands somewhere between $53 and $82.
Bullish Scenario: A strong hold at support combined with a clean channel breakout and rising CCIP adoption across major chains could push LINK toward the $100 to $131 range by 2028.
2028 Price Prediction Table
Scenario | Target Range |
Bearish | $8 - $15 |
Average | $53 - $82 |
Bullish | $100 - $131 |
Risk Reward Snapshot
Factor | Detail |
Key Support | $5.50 - $9.50 |
Key Resistance | Descending Trendline |
The analysis above combines historical price structure with publicly available market data and should not be treated as a guarantee of future performance.
Invalidation Level
This entire setup depends on the $5.50 to $9.50 zone holding as support.
A monthly close below $5 would invalidate the bullish structure, and in that case the descending channel would likely stay in control, pushing LINK toward lower levels before any fresh setup can form.
Is Chainlink a Good Long-Term Investment
$LINK's chart shows a token sitting at a level that has already produced one major rally in the past.
Right now, the $5.50 to $9.50 zone is the level that matters most. For anyone looking at a 2028 horizon, watching how price behaves at this exact support, combined with growing real-world adoption through CCIP, could offer a reasonable read on where the next leg takes LINK.
Expert View
Sentiment around LINK has stayed fairly steady, with several analysts pointing to Chainlink's expanding role in cross-chain infrastructure as a long-term positive, especially with more protocols like Mantle routing activity through CCIP.
The current support retest is being watched closely, since a similar level triggered a sharp rally in the past.
Most agree the coming months at this zone will decide whether LINK is setting up for another major move or heading toward more time spent inside the channel.
Conclusion
$LINK's chart comes down to one level right now, the $5.50 to $9.50 support zone, the same area that fueled a nearly 500 percent rally before.
As long as this zone holds, the setup stays constructive, with a channel breakout opening the door toward the $53.004 to $131.144 target range.
How price reacts here over the next few months will likely shape where LINK stands heading into 2028.
Disclaimer: This article is for informational purposes only and should not be considered financial advice. Cryptocurrency markets are highly volatile, and price predictions are not guaranteed. Please do your own research before making any investment decisions.
Also read:

















