COTI Price Prediction: Coin Explodes 78% After Wedge Breakout


A quiet privacy project just turned into one of the loudest tickers on the board, and COTI price prediction searches are climbing for a reason that has almost nothing to do with hype for its own sake. Traders who bet against it got caught leaning the wrong way more than once, and the candle that followed is the kind people screenshot.
Is this a real turn or a squeeze that runs out of fuel once the forced buying stops? That question is showing up everywhere in current altcoin rally coverage this week. Here is what the chart and the on-chain numbers actually say.
Why Is COTI Price Rising Today?
COTI price prediction searches are climbing fast, and it's not because of a random pump.
A months-long slide just snapped, hard, and the coin behind a privacy-focused payments network is now trading like something changed overnight.
We pulled the charts, the liquidation data, and the wallet breakdown before writing a word of this. What we found isn't a simple story.
There's a chart pattern involved. There's a squeeze involved. And there's a product narrative sitting underneath both.
So which one is actually driving the price, and which one just came along for the ride?
Table of Contents
Key Takeaways
Token Contract
Where COTI Stands Right Now
What Is Driving COTI's Price Today
Technical Analysis: 4-Hour Chart
Technical Analysis: Weekly Chart
The Short Squeeze, In Real Time
Tokenomics and Holder Concentration
Liquidity and Exchange Volume
Bull, Base, and Bear Scenarios
Price Forecast Table
Key Risks
Glossary
Key Takeaways
-
COTI trades near $0.0133 as of the latest snapshot, up roughly 78% in 24 hours, with the weekly candle itself up 79.73%.
-
The 4-hour chart broke clean out of a months-long falling wedge; RSI on that timeframe reads 95.55, deeply overbought.
-
The weekly RSI reads 47.71, still under the neutral 50 line, an unusual gap against a move this size.
-
Immediate 4-hour resistance sits at $0.01579, then $0.01944. Support sits near $0.00717, then $0.00575.
-
Liquidations hit $2.58M over the past 24 hours, with shorts eating $1.94M of that. But in the most recent hour, longs actually took slightly more damage, a sign the squeeze may already be cooling.
-
Holder data shows real concentration: the top 100 wallets control 83.83% of tracked supply, and just 39 whale wallets hold 77.11% of market cap.
-
A private stablecoin narrative from the project team lines up with the timing of this move, adding a fundamental layer on top of the technical breakout.
Token Contract
Contract Address: 0xDDB3422497E61e13543BeA06989C0789117555c5 Standard: ERC-20
Security Rating: CertiK 4.4 / 5
Where COTI Stands Right Now
COTI last changed hands between $0.01312 and $0.01339 depending on the venue, up about 77.5% to 79.7% over the past day. The 24-hour range ran from a low of $0.007357 to a high of $0.01447, a range visible on COTI's CoinMarketCap listing.
Volume over that window came in near $98.59M against a market cap of $38.79M, a vol-to-market-cap ratio above 249%. That's extreme turnover for a token this size.
Circulating supply sits at 2.95B COTI. CoinMarketCap lists max supply at 4.91B, while Etherscan's token page shows a max total supply closer to 3.18B, a gap worth flagging rather than glossing over.
The all-time high, $0.6826, was set back in November 2021, nearly five years ago. The current price sits about 98% below that peak. The all-time low, $0.006226, was set in late 2019, and today's price sits roughly 111% above that floor. This is a coin bouncing off a deep, multi-year hole, not one pressing new highs.
What Is Driving COTI's Price Today
There's no single listing announcement behind this move. Instead, the COTI Foundation posted about private stablecoins, arguing that public-chain transparency is exactly why enterprises won't run payroll on stablecoins yet and framing COTI's privacy layer as the fix.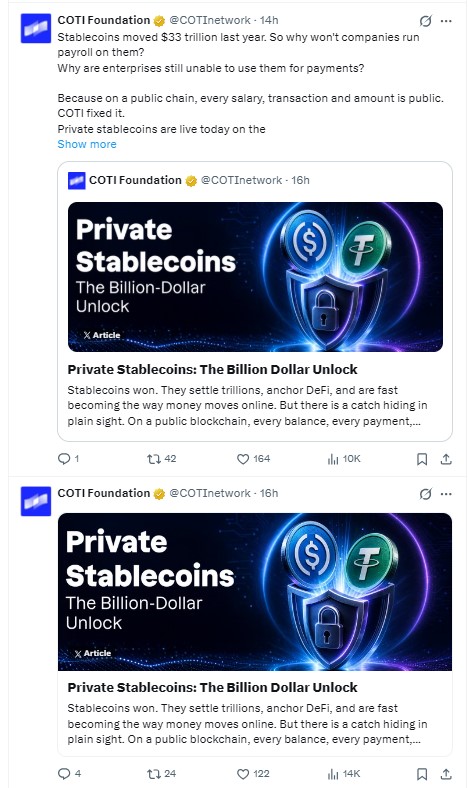
That kind of narrative tends to draw fresh eyes into a token, especially when it lands right as a technical setup is already coiled. Layer a wedge breakout on top of a stablecoin-adoption story, and you get exactly the kind of move that then attracts forced short covering.
Anyone tracking the project going forward can follow upcoming catalysts on the crypto events calendar, since narrative-driven moves like this one tend to repeat around future announcements.
Technical Analysis: 4-Hour Chart
On the 4-hour COTI/USDT chart, price spent weeks grinding lower inside a falling wedge before a single vertical candle broke it wide open, a move visible on TradingView chart data. The candle opened near $0.01282 and closed at $0.01325, a 3.43% move on that bar alone, though the breakout candle itself ran far higher intraday.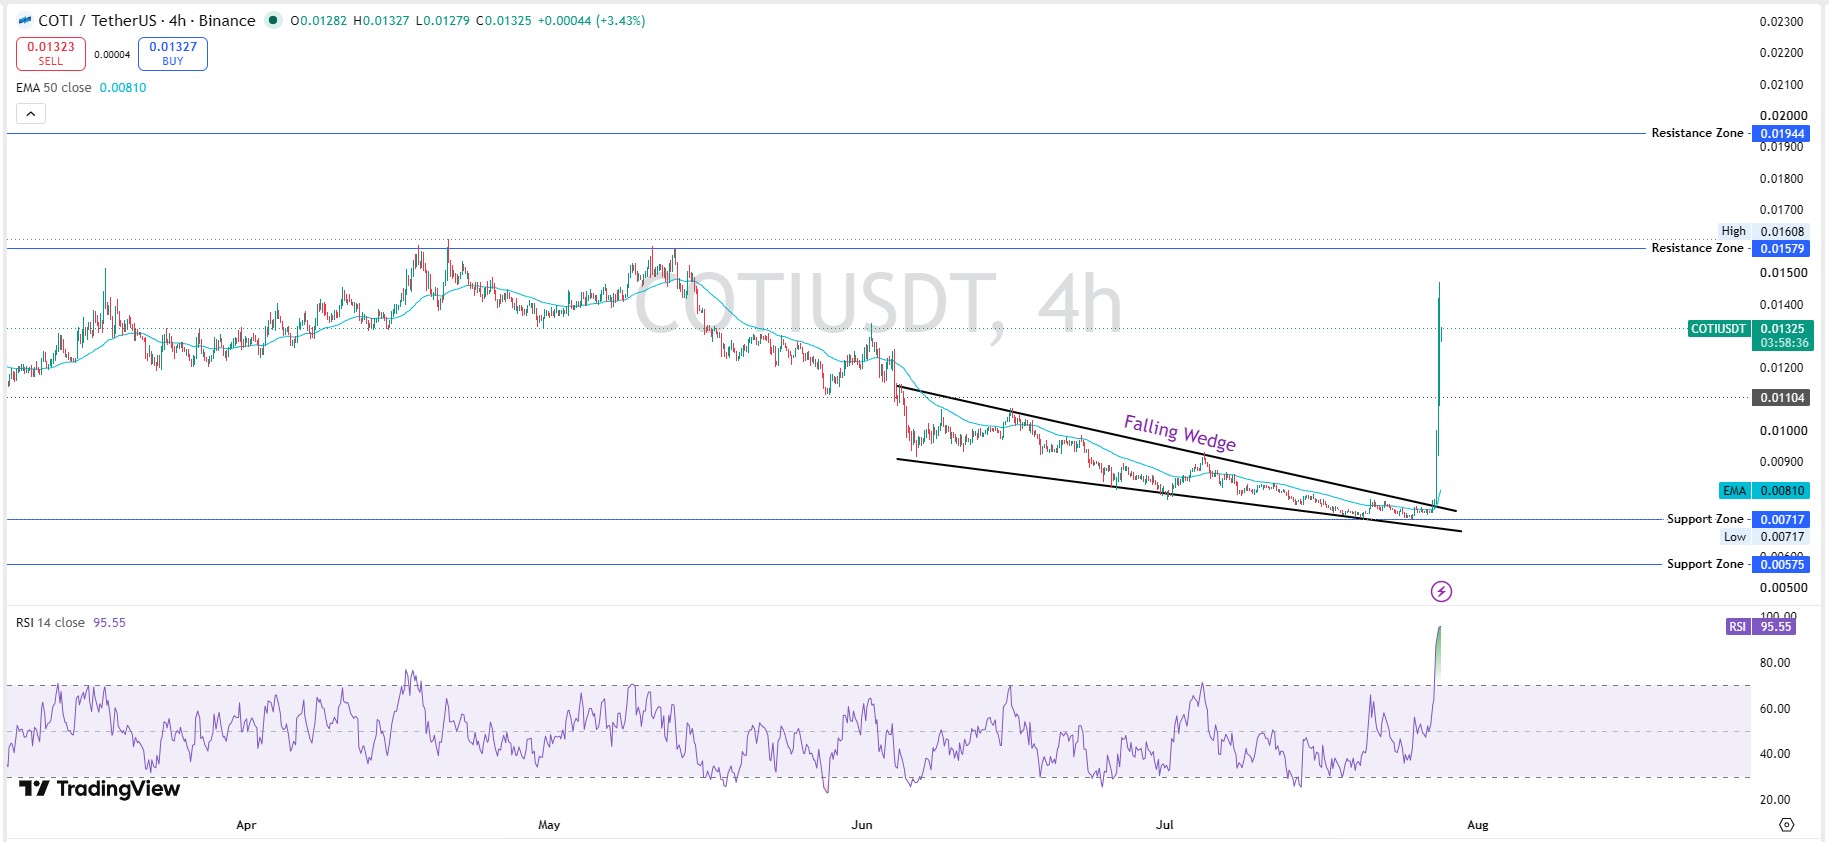
RSI on this timeframe reads 95.55. That's about as stretched as momentum gets.
The 50-period EMA sits at $0.00810, well below spot, confirming the short-term trend just flipped bullish in dramatic fashion.
Resistance sits at $0.01579, then a heavier zone at $0.01944. Support underneath sits at $0.00717, backed by a deeper floor at $0.00575.
4H Support and Resistance
| Level | Price |
|---|---|
| Resistance 2 | $0.01944 |
| Resistance 1 | $0.01579 |
| Current Price | $0.0133 |
| Support 1 | $0.00717 |
| Support 2 | $0.00575 |
Technical Analysis: Weekly Chart
Zoom out and the picture calms down considerably. This week's candle opened at $0.00743 and closed near $0.01339, up 79.73% for the week, breaking a falling wedge that had held since early 2025, a setup similar to patterns flagged in recent Ethereum price prediction coverage of major asset wedge breaks.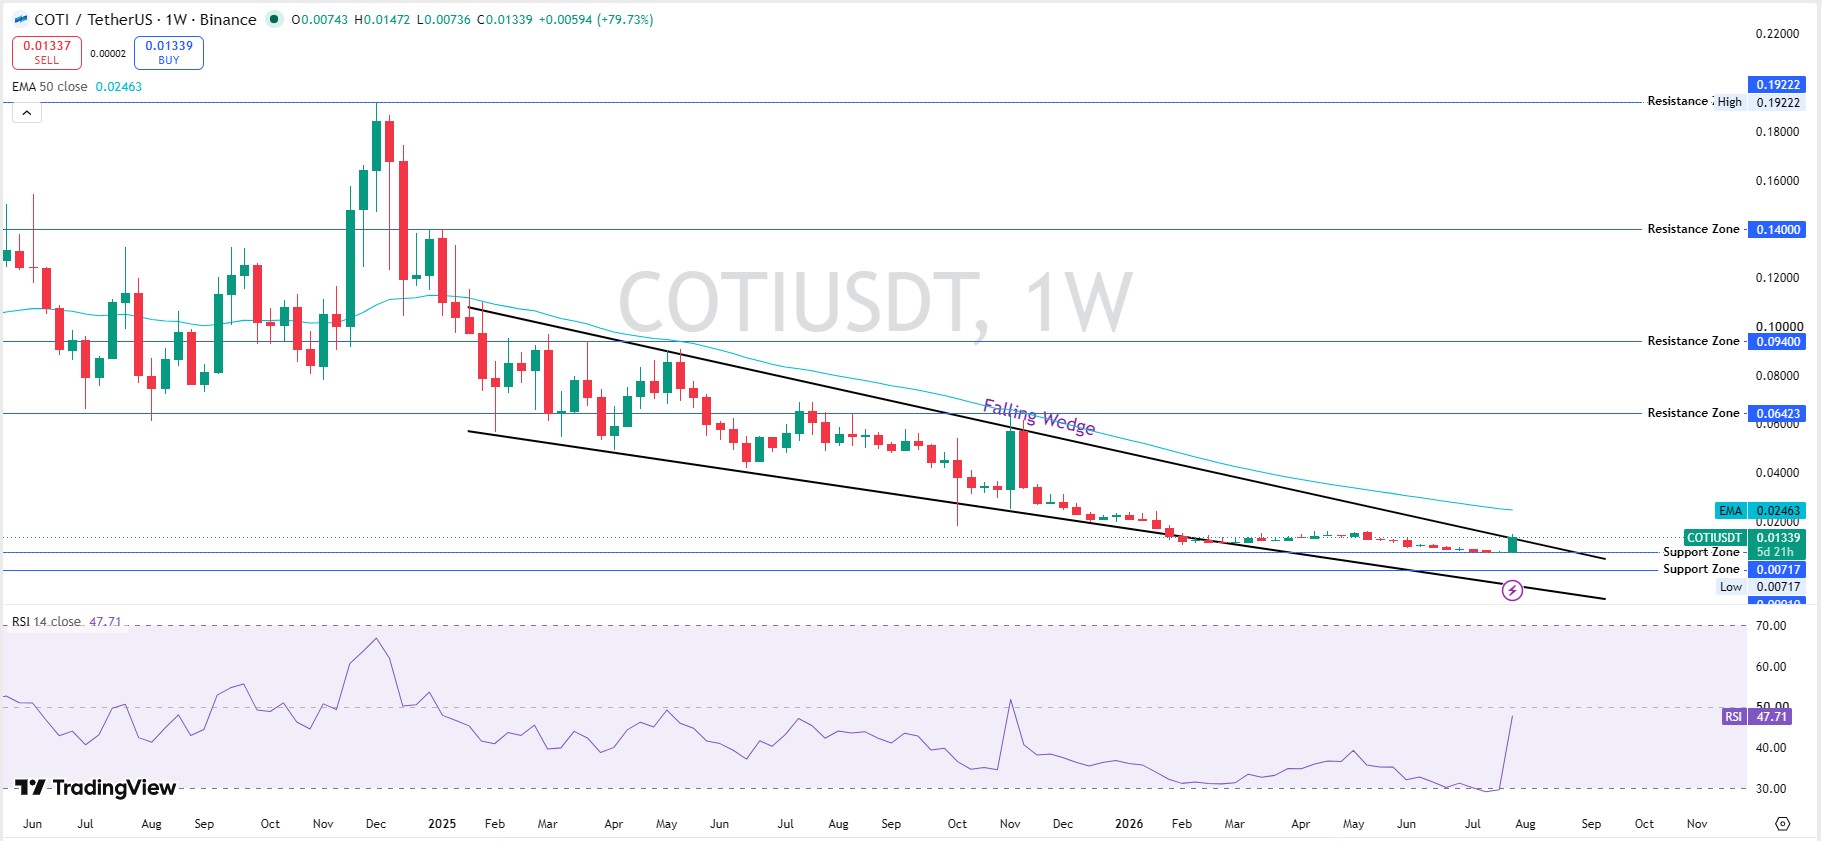
Weekly RSI reads 47.71, still under the neutral 50 mark. That's the real tension in this chart: a massive weekly gain that hasn't even flipped weekly momentum bullish yet.
Above the price, resistance layers stack at $0.06423, $0.09400, and $0.14000, with a longer-term high near $0.19222. Support below sits at $0.00717, right around the breakout zone itself.
Weekly Support and Resistance
| Level | Price |
|---|---|
| Resistance 3 | $0.19222 |
| Resistance 2 | $0.09400 |
| Resistance 1 | $0.06423 |
| Current Price | $0.01339 |
| Support 1 | $0.00717 |
The Short Squeeze, In Real Time
Liquidation data backs up the squeeze story, though not everywhere equally, a pattern that shows up clearly on the Coinglass liquidation tracker. Over the past hour, $242.51K was liquidated, and here's the twist: longs took $133.19K of that against $109.32K in shorts. That's a shift from the trend that dominated earlier windows.
Over 4 hours, total liquidations reached $1.21M, with shorts still taking the bigger hit at $901.25K versus $306.82K long. Zoom out to 12 and 24 hours, and totals land around $2.58M in both, with shorts absorbing roughly $1.94M against $641K to $644K on the long side.
Liquidation Snapshot
| Window | Total | Long | Short |
|---|---|---|---|
| 1h | $242.51K | $133.19K | $109.32K |
| 4h | $1.21M | $306.82K | $901.25K |
| 12h | $2.58M | $641.15K | $1.94M |
| 24h | $2.58M | $644.14K | $1.94M |
The recent flip toward long-side liquidations in the 1-hour window is worth watching. It could mean early longs are already taking profit or that the squeeze is running out of shorts left to flush out.
Tokenomics and Holder Concentration
COTI's contract is an ERC-20 token rated 4.4 out of 5 by CertiK, with full supply and holder details visible on Etherscan token holder data. Holder concentration here is steep, a pattern worth comparing against other CertiK-audited token launches that carry similar security ratings.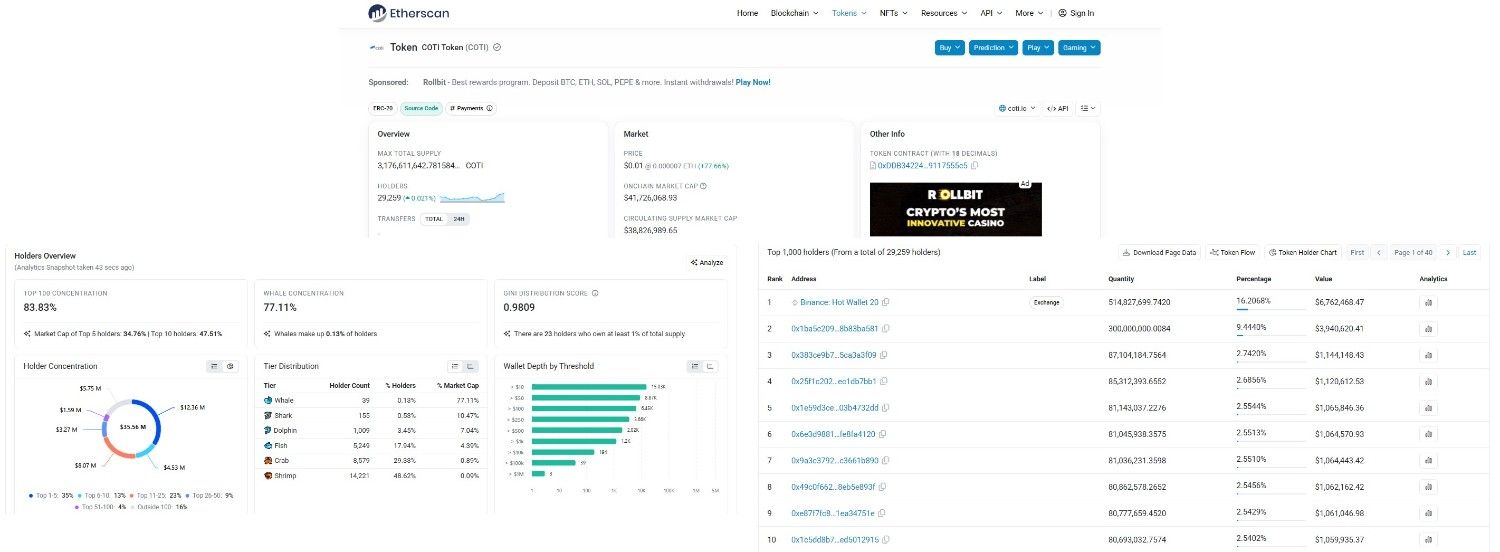
The top 100 wallets control 83.83% of the tracked supply, and just addresses classified as whales, only 0.13% of all holders, reportedly hold 77.11% of tracked token supply. This category includes exchange, custodian, contract, treasury, or other shared addresses and should not be interpreted directly as individual whale ownership. The Gini score sits at 0.9809, close to maximum inequality, based on on-chain wallet data as tracked at the time of writing. This figure does not separate exchange, custodian, contract, or treasury addresses from individual holders, so it should be read as a rough concentration signal rather than a precise measure of individual ownership. Twenty-three wallets each hold at least 1% of the total supply.
Holder Tier Distribution
| Tier | Holders | % Holders | % Tracked Supply |
|---|---|---|---|
| Whale | 39 | 0.13% | 77.11% |
| Shark | 155 | 0.53% | 10.47% |
| Dolphin | 1,009 | 3.45% | 7.04% |
| Fish | 5,249 | 17.94% | 4.39% |
| Crab | 8,579 | 29.33% | 0.89% |
| Shrimp | 14,221 | 48.62% | 0.09% |
The largest single wallet is Binance's Hot Wallet 20, holding 16.21% of supply, an exchange balance rather than a single accumulating whale. The second-largest wallet, unlabeled, holds 9.44%. Wallets three through ten are all unlabeled addresses, each holding between roughly 2.5% and 2.7% of the supply, a distribution pattern quite different from airdrop-driven token launches, where supply often starts more evenly spread.
Holder Count Caveat CoinMarketCap lists 45.09K holders, while Etherscan's token page shows 29,259. Anyone sizing a position should check holder data across more than one source before treating either figure as final.
Liquidity and Exchange Volume
Liq/Mkt Cap sits at 0.51%, on the thinner side for a token moving this fast. Futures volume is heavily concentrated on one venue.
Futures Volume by Exchange (24H)
| Exchange | Volume |
|---|---|
| Binance | $188.06M |
| Bybit | $39.73M |
| Bitget | $19.38M |
| Bitunix | $11.53M |
| MEXC | $11.15M |
| Gate | $6.01M |
Binance alone accounts for the large majority of futures turnover here. That kind of single-venue dominance means derivatives positioning, not organic spot demand, is doing most of the work behind this candle, and it's worth checking current exchange listing coverage before assuming volume is spread evenly across the market.
Bull, Base, and Bear Scenarios
None of this is financial advice. These are scenario-based ranges built from current chart structure, not guarantees, and they sit alongside the wider price prediction coverage on the site for broader market context.
Bull Case: A daily close above $0.01579 opens a path toward $0.01944 within 7 to 14 days. Probability roughly 30%, contingent on the stablecoin narrative keeping fresh volume flowing in. Invalidation: a daily close back below $0.0115.
Base Case: Price consolidates between roughly $0.0100 and $0.0160 over the next 7 to 30 days as the squeeze unwinds. The probability is highest, around 45%. Invalidation: a clean weekly close outside either boundary.
Bear Case: Momentum fades and price retraces toward the $0.00717 support zone, with a deeper test possible if the wider market cools. The probability is roughly 25%. Invalidation: sustained volume holding above $0.0140 for more than a week.
Price Forecast Table
| Timeframe | Bear | Base | Bull |
|---|---|---|---|
| 24H | $0.0110 | $0.0133 | $0.0155 |
| 7D | $0.0085 | $0.0125 | $0.0180 |
| 30D | $0.0065 | $0.0140 | $0.0245 |
| 6-12 Months | $0.0040 | $0.0160 | $0.0450 |
These figures aren't predictions of certainty. They're ranges built around the support and resistance levels already visible on the chart.
Key Risks
Extreme short-term overbought conditions top the list, with 4-hour RSI near 95 leaving little room before a cooling period. Holder concentration is steep, and the Gini score of 0.9809 points to a thin real float outside the top wallets, though this figure does not separate exchange or custodial addresses from individual holders. Single-exchange futures dominance means this move is currently driven by borrowed positioning rather than broad spot accumulation. Distance from the all-time high, still down about 98%, is a reminder that the longer-term trend remains a deep drawdown that hasn't reversed itself.
Wider Bitcoin market news and sector-wide swings can override any single token's setup, so COTI's chart should always get read alongside the rest of the latest crypto news rather than in isolation.
Glossary
RSI: A 0-100 momentum indicator. Above 70 typically signals overbought; below 30 signals oversold.
EMA: A trend-following average that weights recent prices more heavily than older ones.
Falling Wedge: A chart pattern where price compresses between two downward-sloping lines, often resolving with a breakout higher.
Gini Score: A measure of distribution inequality, from 0 to 1.
Liquidation: The forced closing of a leveraged position when losses exceed the trader's margin.
Vol/Mkt Cap: Trading volume divided by market capitalization, a rough measure of turnover.
Invalidation Level: The price point at which a trading thesis is considered wrong and should be abandoned.
Disclaimer: This article is for informational purposes only and does not constitute financial advice. Cryptocurrency markets are highly volatile. Always do your own research and consult a licensed financial advisor before making investment decisions.