Dolphin Price Prediction 2026-2030: Can POD Reach $1?


Two wallets control over 90% of the Dolphin supply. And POD just ripped 59.7% higher anyway, wicking into a resistance level that has capped every rally since June. Something pulled traders back to this chart today, and it was not just the candle. This Dolphin price prediction breaks down whether the move holds, where it fails, and the exact levels that flip the setup from a bounce into a real breakout.
Quick Prediction Box
Metric | Current View |
Current Price | $0.3957 |
24H Change | +59.7% |
Trend | Bullish (short-term), inside a longer descending channel |
Next Resistance | $0.4091 (R1) |
Next Support | $0.2553 (S1) |
RSI (14) | 53.96 |
Bull Target | $0.5115 |
Base Target | $0.4091 |
Bear Target | $0.2553 |
Invalidation | $0.1565 |
That's the whole setup in one glance. Now let's break down why each number matters.
Dolphin Price Prediction: What Traders Need to Know
Dolphin (POD) trades at $0.3957 as of 09:54 UTC, up 59.7% across 24 hours per CoinGecko's live feed.
The trend leans bullish for now, with the price above its 50-period EMA and momentum turning.
The immediate target sits at $0.4091, the first Fibonacci extension level. The support zone at $0.2553 is what bulls need to defend.
Resistance stacks up fast above $0.41. And the biggest catalyst here isn't technical; it's a listing rumor.
CoinGecko's token page references a Coinbase roadmap addition for POD, the single biggest risk-reward variable here. Verify it before acting.
Why Is Dolphin POD Price Moving Today?
POD Rally and Trading Volume
The daily candle opened at $0.3202 and pushed as high as $0.4009 before pulling back near $0.3944 to $0.3957, the small gap between the chart print and the live feed.
That's a 23.20% intraday swing. And the live POD chart shows an even sharper 24-hour move, up 59.7% from a low of $0.2375.
Volume over 24 hours sits at $6.868M against an $18.1M market cap. That ratio is exactly what inflates candle wicks on thin-cap tokens.
Dolphin AI and DePIN Narrative
Dolphin sits in CoinGecko's Artificial Intelligence category, with extra tags the page lists as "3 more." That framing has powered many small-cap tokens tracked in AI crypto coverage through 2026.
Here's the thing: a narrative tag alone doesn't move a chart. Volume does, and it followed this rally, not the reverse.
Coinbase Listing Roadmap Catalyst
The Dolphin token page on CoinGecko references news of POD joining Coinbase's public listing roadmap. Roadmap additions have historically sparked double-digit rallies for small-cap tokens.
This needs verification through official channels before anyone treats it as confirmed. Rumors move faster than filings.
Dolphin Technical Analysis and Key Price Levels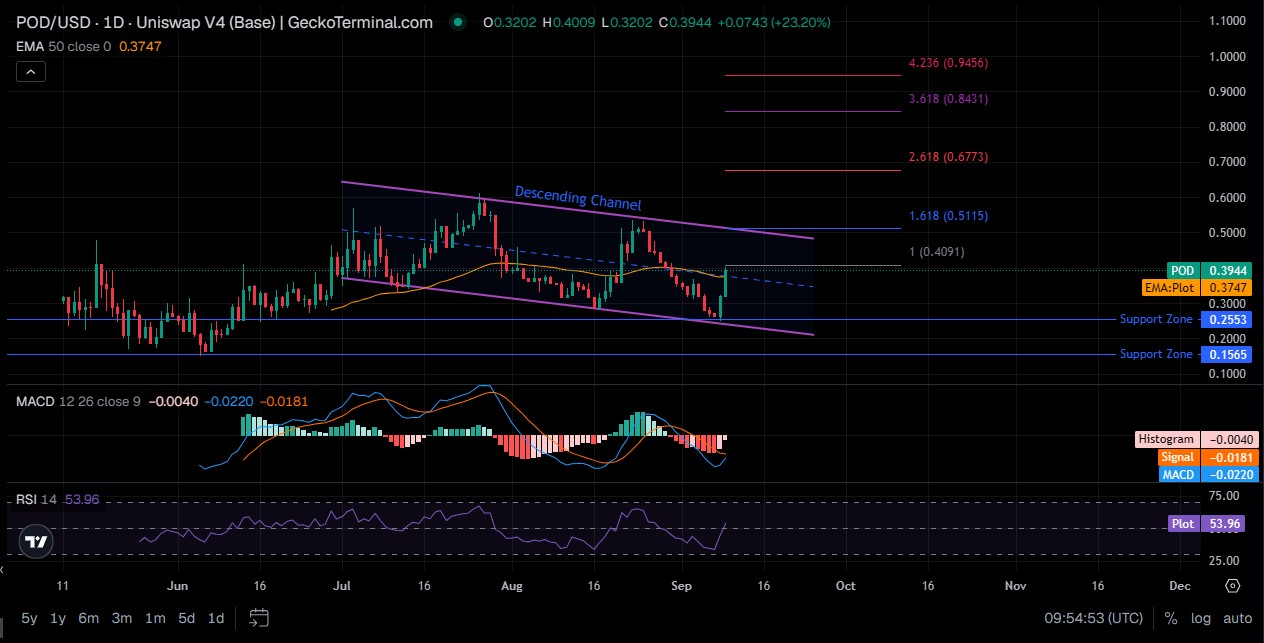
POD Support Levels
Two support zones show up on the GeckoTerminal daily chart. The first sits at $0.2553, roughly 35% below current trading levels.
A second, deeper zone sits at $0.1565, and a trade below it breaks the structure built since June.
POD Resistance Levels
Resistance starts close. The 1.0 Fibonacci extension sits at $0.4091, right where today's candle wicked.
Above that: 1.618 at $0.5115, 2.618 at $0.6773, 3.618 at $0.8431, and 4.236 at $0.9456, each harder to reach without fresh volume.
RSI and MACD Signals
RSI (14) reads 53.96. Neutral. Not overbought, just recovering off a mid-range base.
MACD tells a different story: the line sits at -0.0181 against a -0.0220 signal, a small positive histogram near 0.0040.
That's an early bullish crossover below the zero line, not a full reversal yet, but the first one in weeks.
Trend and Moving Averages
Price trades above the 50-period EMA at $0.3747, typically a short-term bullish signal.
And yet it still sits inside a descending channel from the July high. Two things can be true at once.
Breakout Confirmation
A close above $0.4091 on matching volume confirms the breakout. Anything less risks a fade back to the EMA.
Dolphin Price Prediction for the Next 7 Days
Day | Bear | Base | Bull |
Day 1 | $0.34 | $0.39 | $0.44 |
Day 3 | $0.29 | $0.40 | $0.48 |
Day 5 | $0.26 | $0.41 | $0.51 |
Day 7 | $0.24 | $0.42 | $0.55 |
These figures aren't guesses. They're built off the existing support, resistance, and volatility range.
Dolphin Price Prediction for the Next 30 Days
Bull Case
A confirmed breakout past $0.4091, backed by real listing news, could push POD toward $0.68, roughly 72% upside.
Base Case
Consolidation between $0.30 and $0.45 looks likely if the rally cools without confirmation, roughly flat to +14%.
Bear Case
A failed breakout paired with profit-taking could send POD back to $0.2553, a decline near 35%.
Dolphin Price Prediction 2026
Low: $0.15 (deep support retest if the AI narrative fades)
Base: $0.45 (range trading with catalyst-driven pops)
High: $0.95 (full extension run on sustained listing demand)
Catalysts: a confirmed Coinbase listing, AI-sector rotation, and rising DePIN adoption. Risks: whale distribution and thin liquidity.
Invalidation for the bullish case sits at $0.1565. Lose that, and the base case goes too.
Dolphin Price Prediction 2027-2030
Year | Bear Case | Base Case | Bull Case |
Y1 (2027) | $0.10 | $0.55 | $1.10 |
Y2 (2028) | $0.08 | $0.70 | $1.45 |
Y3 (2029) | $0.12 | $0.85 | $1.80 |
Y4 (2030) | $0.15 | $1.00 | $2.20 |
Dolphin Price Prediction 2027: A listing confirmation or fade decides the range, from a $0.10 breakdown to a $1.10 push if Coinbase news lands and demand holds.
Dolphin Price Prediction 2028: network usage becomes the swing factor, base case holds near $0.70, while the bull case needs real buyback and staking traction for $1.45.
Dolphin Price Prediction 2029: wider AI-sector adoption could carry POD toward $0.85 base, with $1.80 only if whale wallets stay quiet and volume stays steady.
Dolphin Price Prediction 2030: The base case settles near $1.00 on steady demand, while the $2.20 bull case needs sustained network utility, not another speculative rally.
We kept the bull case grounded instead of chasing unsupported multiples. A 500M max-supply token needs real, sustained demand to hold $1.
Can Dolphin (POD) Realistically Reach $1?
The math here isn't as scary as it looks. At the current 45.86M circulating supply, a $1 price tag only needs a $45.86M market cap, just 2.5x today's $18.1M.
But full dilution changes the picture. Max supply sits at 500M, so a genuine $1 across every token pushes fully diluted valuation to $500M, also 2.5x today's $197.364M FDV.
That's not an outrageous ask for a token riding an AI narrative with a live listing rumor attached. Small-cap tokens have done 2.5x in weeks on far less.
But there's a catch. Two wallets hold 90.83% of the supply. A short squeeze toward $1 is possible. Holding $1 without those wallets selling into it is a different question entirely.
Our take: a spike toward $1 fits the realistic bull case for 2027 to 2028, not 2026. Reaching it, and keeping it, needs the Coinbase listing confirmed and those top wallets staying quiet.
Dolphin Tokenomics and Supply Risk
Circulating Supply vs. Maximum Supply
Circulating supply sits at 45.86M against a max supply of 500M, per CoinGecko, just 9.17% of total supply.
FDV Risk
Fully diluted valuation reads $197.364M against an $18.102M market cap, a gap near 11x.
Should the remaining 454M tokens enter circulation without matching demand, today's price cannot hold. Math doesn't negotiate.
Unlocks and Treasury Supply
Holder data on Basescan adds weight here: the top two wallets hold 54.84% and 35.98% of supply, a combined 90.83%.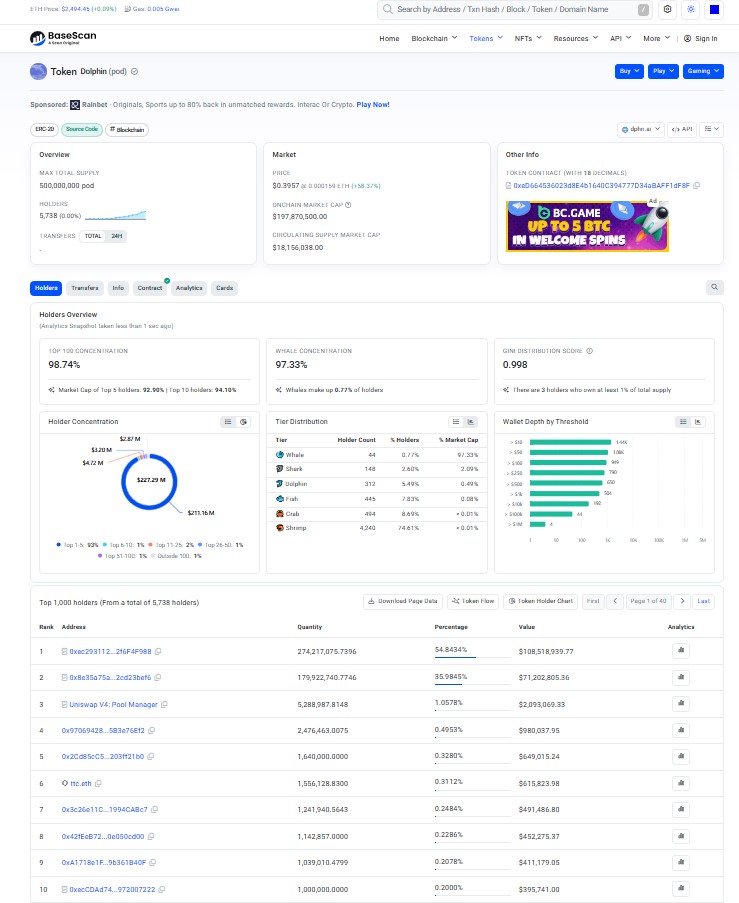
The top 100 addresses control 98.74% of the token, and the Gini score sits at 0.998, near maximum inequality.
Not a healthy distribution. Three or four wallets decide this token's fate.
Dolphin Price Prediction Bull, Base and Bear Scenarios
Scenario | Conditions | Target |
Bull | Breakout above $0.4091 plus volume plus confirmed Coinbase listing | $0.68 to $1.00 |
Base | Consolidation, steady demand, no major catalyst confirmation | $0.30 to $0.45 |
Bear | Loss of $0.2553 support, volume reversal, whale selling | $0.15 to $0.20 |
What Could Push POD Higher?
Exchange listings top the list, especially the rumored Coinbase addition. Track confirmed additions through the exchange listing tracker, since tier-one listings bring fresh liquidity fast.
The AI narrative helps too, as does growing DePIN adoption if network usage climbs. CoinEx flags node participation, staking, and buyback activity as the metrics worth watching.
GPU demand, protocol revenue, and a confirmed buyback program would add real support beneath speculative moves. Similar setups sit in the price prediction archive.
What Could Push Dolphin Price Lower?
Supply dilution tops the list. With 90% of supply across two wallets, one sell order could crater this chart, a pattern also common across tokens in CoinGabbar's meme coin news section.
Low liquidity compounds the risk here. CoinGecko itself flags contract-control concerns worth reviewing first.
CoinEx separately flags migration risk, the FDV gap, and competition from other AI tokens. A failed breakout paired with a Bitcoin correction would speed up any decline.
Weak network adoption removes the entire bull case. No usage, no narrative.
Dolphin Trader Takeaway
Bullish above: $0.3747 (50 EMA)
Neutral between: $0.2553 and $0.3747
Bearish below: $0.2553
Breakout confirmation: $0.4091 with matching volume
Invalidation: $0.1565
Is this rally sustainable, or is it two wallets and a rumor doing all the work? That's the question every trader needs to sit with before sizing a position here.
Anyone timing entries around the rumored Coinbase news should watch the coin events calendar for confirmation dates.
And yield-focused traders holding POD or similar Base-chain names can check current crypto airdrop listings before the next catalyst hits.
Disclaimer
This article is for informational purposes only and does not constitute financial, investment, or trading advice. Cryptocurrency markets, especially low-cap and thinly-traded tokens like Dolphin (POD), are highly volatile and carry substantial risk, including the risk of total capital loss. Data referenced was accurate as of September 9, 2026, 09:54 UTC and may have changed. Always do your own research and consult a licensed financial advisor before making any investment decisions.

















