Ethereum Price Prediction: Can ETH Break Free From BTC's Grip?


Ethereum is trading close to $1,845 today, up a small amount over the past day.
This Ethereum price prediction looks at what's driving the market right now, and the bigger story isn't the price itself. It's what's happening between ETH and Bitcoin
What is Ethereum's price today?
The altcoin is changing hands around $1,845.53, with a modest gain of about 0.65% on the day. Trading volume across futures markets sits near $30.88 billion, though that's down close to 28% from the prior session.
Open interest, which tracks how many futures contracts are still active, actually rose slightly to $25.88 billion. That tells us traders aren't rushing for the exits even as spot volume cools off.
Metric | Value | 24h Change |
Price | $1,845.53 | +0.65% |
Futures Volume | $30.88B | -27.79% |
Spot Volume | $1.35B | — |
Open Interest | $25.88B | +0.53% |
Market Cap | $222.56B | — |
Circulating Supply | 120.68M ETH | — |
Is the ETH/BTC breakout real?
This is where things get interesting for anyone searching Ethereum price prediction content this week. Analyst Celal Kucuker flagged what looks like a high-timeframe breakout on the ETH/BTC chart.
For months, Bitcoin has quietly outperformed Ethereum. That trend appears to have paused. The ETH/BTC pair recently pushed above a long-term downtrend line that had capped it since late 2024.
If that trendline break holds, it often signals the start of what traders call an altseason, a stretch where alternative coins like Ethereum start gaining ground against Bitcoin. Nothing is guaranteed here, but the setup is worth watching.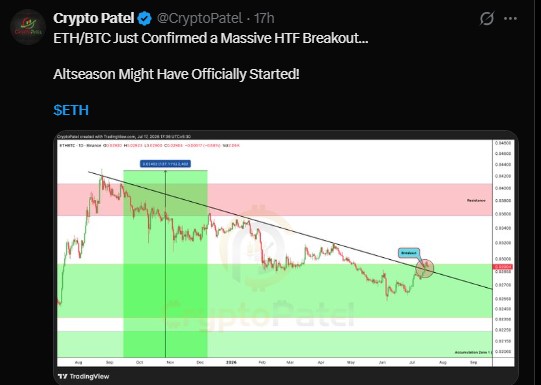
What does the Wyckoff pattern suggest for Ethereum?
Some chart watchers point to a Wyckoff accumulation structure on Ethereum's weekly chart.
In simple terms, this pattern shows big buyers slowly building positions during a period of sideways or falling prices, before a stronger move begins.
According to this reading, the pattern stays valid as long as ETH holds above roughly $1,500. A break below that level would likely invalidate the setup.
Some longer-term targets floated by chart analysts stretch toward $10,000, though that kind of move would take significant time and favorable market conditions.
Readers should treat far-out targets as scenarios, not promises.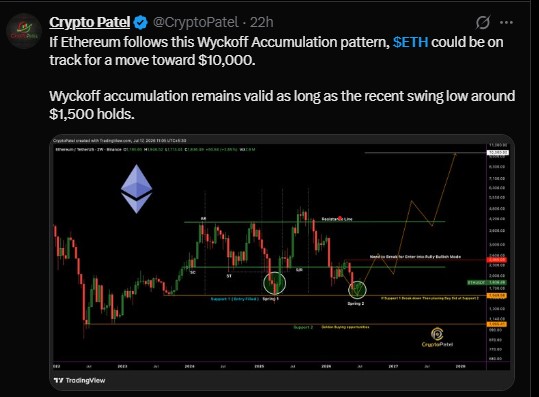
Are Ethereum whales buying or selling?
Whale behavior is mixed right now. Large holders are still sitting on profits overall, but those profits have been shrinking as ETH pulled back from higher levels.
At the same time, ETH deposits into Binance remain elevated. When whales move coins onto exchanges, it often means they're preparing to sell, so this keeps some selling pressure in play.
There's a counterbalance, though. Whale wallets are also holding large stablecoin reserves in USDT and USDC. That gives them the option to buy back in quickly if sentiment shifts, rather than just sell.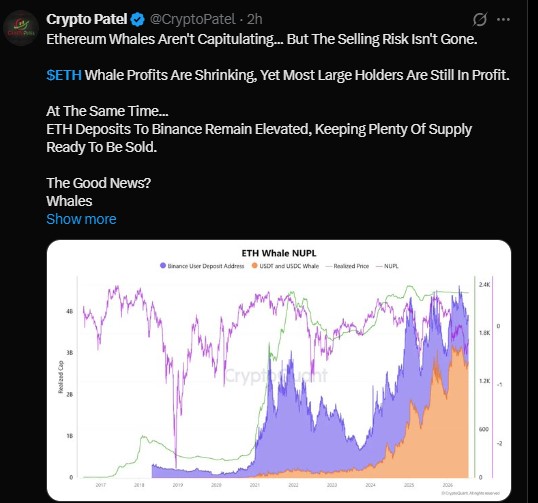
What could trigger the next big move?
The next major move likely depends on where that stablecoin capital flows. If whales start deploying those reserves into the altcoin, it could support a stronger rally.
If they instead lean on exit liquidity, the deposits sitting on Binance could weigh on price.
Liquidation data adds another layer. Over the past 24 hours, short positions saw far more liquidations, around $40.61 million, compared to $29.33 million on the long side.
That suggests short sellers have been getting squeezed more than longs recently.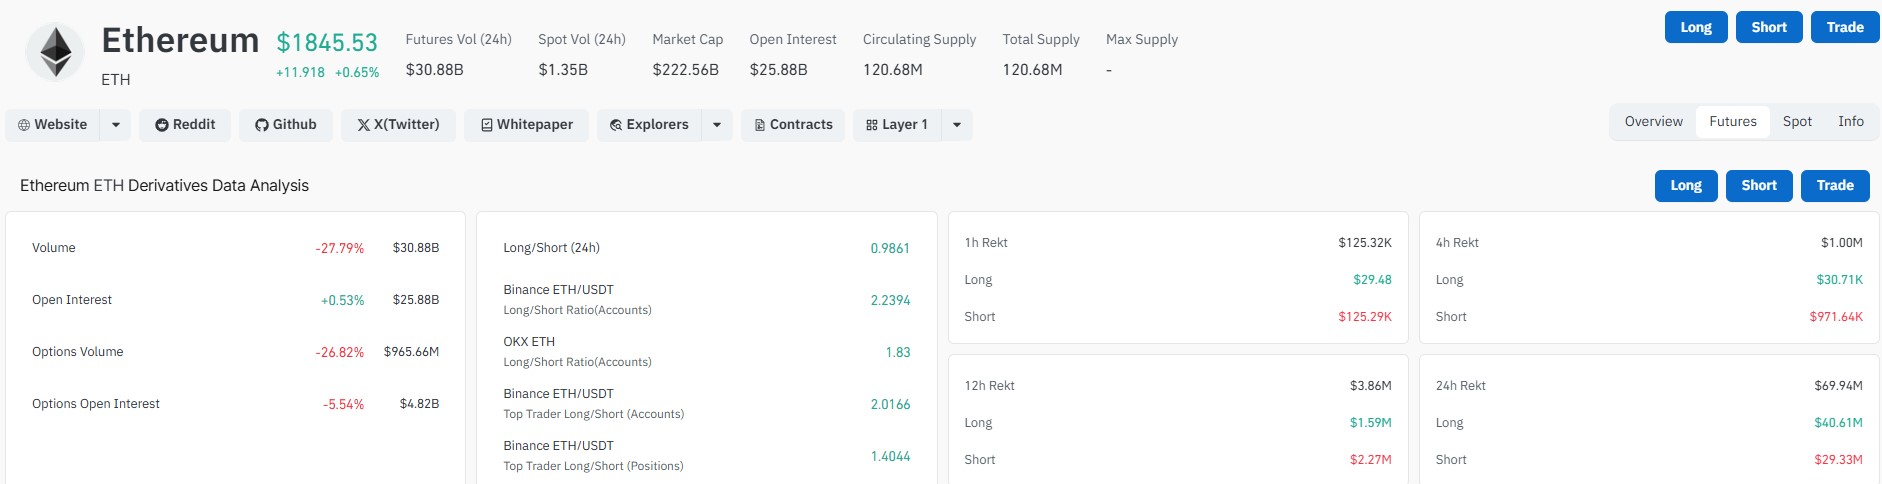
The bottom line for Ethereum right now
This Ethereum price prediction shows a market at a technical crossroads. The ETH/BTC breakout, if it holds, would be a meaningful shift after a long stretch of underperformance against Bitcoin.
The Wyckoff structure gives bulls a story to watch, with $1,500 as the level that matters most.
Whale data leans cautiously balanced. Profits are thinning but not vanishing; deposits are up, but so are stablecoin reserves. This is a market waiting for direction rather than one that has already picked a side.
Disclaimer
This article is for informational purposes only and does not constitute financial, investment, or trading advice. Cryptocurrency markets are highly volatile and unpredictable. Always do your own research and consult a licensed financial advisor before making investment decisions.
Also read:
















