Ethereum Price Prediction: This ETH Signal Hasn't Failed Yet


Ethereum is sitting at a quiet but important spot on the chart. The coin bounced after testing the lower end of its trading channel near $1,850.
As long as that floor holds, traders are watching for a move back up toward $2,060. That's the upper edge of the current range.
This Ethereum price prediction looks at the technical setup, crowd sentiment, and a growing corner of the derivatives market that's starting to pull volume away from traditional ETFs.
What is Ethereum's price doing right now?
ETH traded around $1,861 on the two-week chart, down about 0.51% on the session. The high was near $1,954 and the low touched $1,842.
That puts price right in what one analyst marked as a "strong support" zone, roughly between $1,350 and $3,945 on longer time frames.
The chart also shows a long-term Elliott wave count. It labels the current move as wave 5, with a possible top forming sometime in the 2026-2027 window.
One version of the chart even flagged a theoretical 1,480% move from the accumulation zone, though that kind of number is speculative and far from guaranteed.
Why does bearish sentiment sometimes mean a bounce?
Sentiment data from Santiment shows something interesting. Ethereum's positive versus negative comment ratio has turned bearish for the third time in the past month across X, Reddit, and Telegram.
On the surface, that sounds bad. But the firm's research points out this pattern has shown up before. The last two similar sentiment dips were followed by rebounds of around 14% and 7%.
The idea is simple. When traders are loudly giving up on Ethereum, while ETF flows, Layer 2 activity, and protocol upgrades stay active underneath, it can set up a cleaner turnaround before the crowd feels comfortable again.
That's not a promise of a bounce. It's a pattern worth watching, not a rule.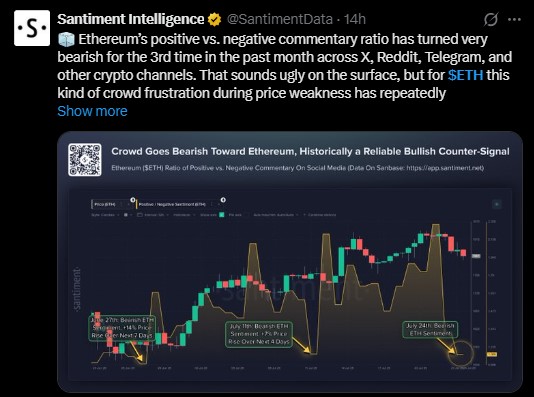
How big is the ETF perpetuals trading trend?
As per crypto analyst Ali, a separate but related story is unfolding in ETF-linked perpetual futures. This corner of the market has become one of 2026's fastest-growing trading categories.
Cumulative volume has passed $116 billion. That's about 19% of all traditional finance perpetual volume in July, with roughly 170% average monthly growth over the past seven months.
ETF Perpetual | Cumulative Volume |
SOXL (3x Semiconductor Bull) | $41.97 billion |
KORU (3x South Korea Bull) | $16.15 billion |
EWY (MSCI South Korea) | $8.43 billion |
QQQ | $5.94 billion |
SPY | $1.71 billion |
One standout detail: trading volume for Binance's KORU perpetual reached 148% of the underlying ETF's own trading volume. More leveraged Korean equity exposure traded through Binance than through the ETF itself.
Global ETF assets sit around $23.09 trillion, while monthly ETF perpetual volume is close to $100 billion. If perpetuals ever reached 10% of March 2026 ETF turnover, monthly volume could approach $780 billion. That's a big "if," but it shows how fast this niche is scaling.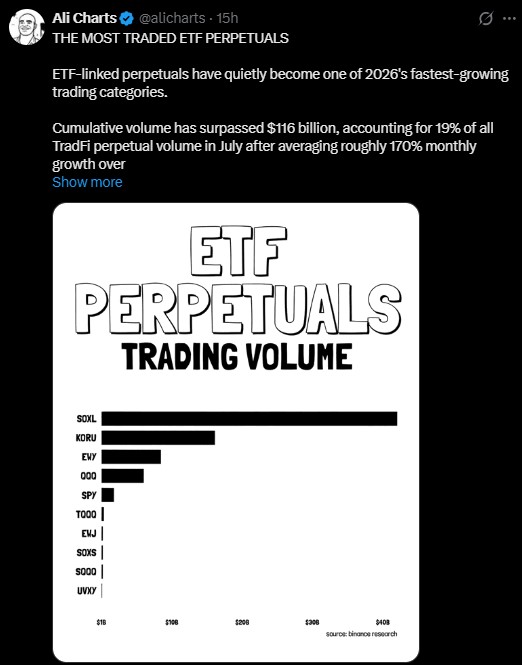
What levels matter most for Ethereum right now?
Support: $1,850 is the level to watch. A clean break below could open the door to more downside testing.
Resistance: $2,060 marks the upper boundary of the current channel. A move above that would be the first sign of renewed short-term strength.
Ethereum's bigger picture wave count suggests a possible long-term top somewhere in the 2026-2027 range, but near-term price action will likely hinge on whether $1,850 keeps holding.
Disclaimer
This article is for informational purposes only and does not constitute financial, investment, or trading advice. Cryptocurrency markets are highly volatile and carry significant risk. Always do your own research and consult a licensed financial advisor before making investment decisions.



















