Harmony ONE Price Prediction: Can ONE Recover After Exploit?


Harmony has confirmed an unauthorized minting incident on its mainnet, and the token is reacting accordingly.
This Harmony ONE Price Prediction looks at what the exploit actually changes and what it does not for a token that was already deep inside a multi-month downtrend before this week's news broke.
Why Is ONE Under Pressure?
Harmony's official X account published an incident update on August 13, 2026, confirming unauthorized minting of native ONE tokens on the Harmony Mainnet, with the incident placed at August 12, 2026, 05:25:40 UTC and the first activity identified on Shard 0 at block 92,730,036.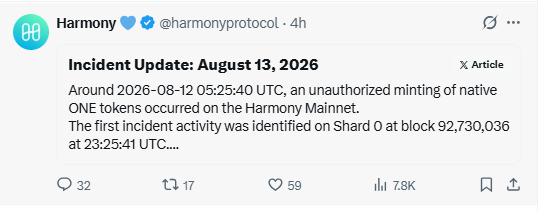
No verified figure for the amount minted has been published, and this article does not speculate on one.
ONE has been sliding inside a broad descending channel since roughly May, well before this incident, so the exploit is not the origin of the downtrend, only a fresh shock to an already weak structure.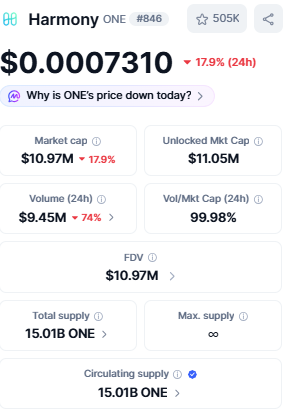
Price is down about 17.9% over the past 24 hours to near $0.0007310, while trading volume jumped roughly 74% over the same window, pointing to a genuine spike in participation during the selloff rather than a quiet drift lower.
Derivatives Positioning and Liquidations
CoinGlass data from August 14 shows open interest near $12.33 million, a sharp jump against its recent baseline.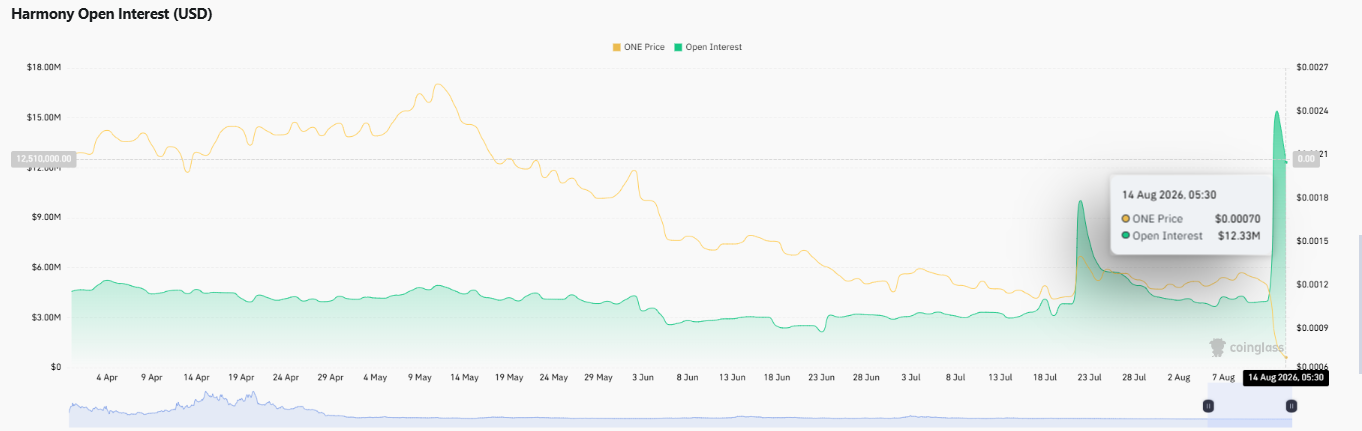
That reflects a sudden rise in leveraged activity around the exploit headline rather than a directional signal, and it raises the odds of amplified volatility and further liquidations in either direction.
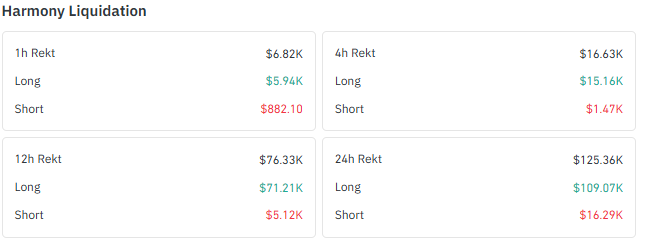
Liquidations over the past 24 hours totaled $125.36K, with $109.07K coming from long positions against just $16.29K on the short side, and shorter windows show the same lopsided pattern, consistent with leveraged bulls getting caught offside, not a signal of where price goes next.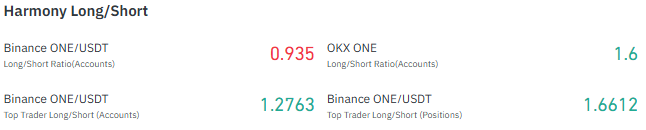
Positioning across exchanges is mixed. Binance's general account ratio sits slightly short at 0.935, while its top-trader accounts lean long at 1.2763 and top-trader positions at 1.6612. OKX accounts lean long too at 1.6 against a clean directional read.
How Has ONE Performed Recently?
The token is down 44.31% over the past week and 39.97% over the past month.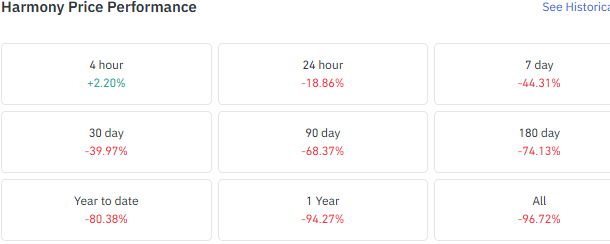
ONE is down 80.38% year-to-date and 94.27% over the past year, a picture that frames the current exploit-driven leg as an acceleration of existing weakness rather than an isolated event.
Where Does the Daily Chart Stand Now?
The TradingView daily chart shows ONE trading inside a descending channel intact since around May, and the latest sell-off has pushed the price toward the lower portion of that structure, currently near $0.000715.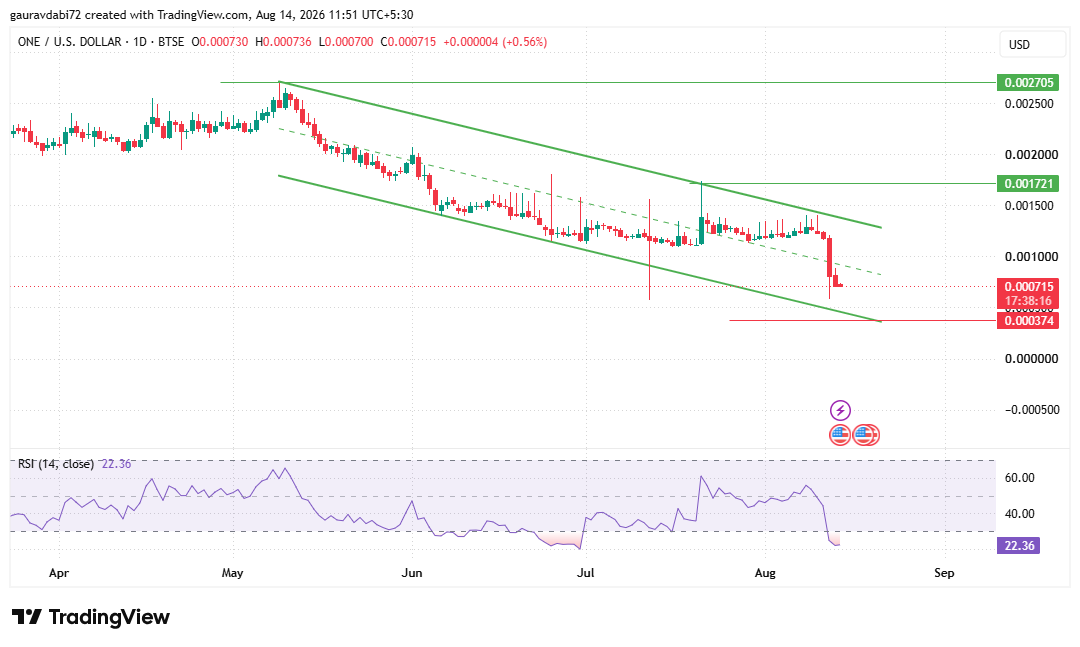
Daily RSI has dropped to 22.36, deep into oversold territory,Daily RSI has dropped to 22.36, deep into oversold territory.
That leaves room for a short-term relief bounce, but oversold conditions alone do not confirm that selling pressure has ended
The major downside support to watch sits at $0.000374, relevant only if selling pressure continues and the lower channel boundary gives way.
On the upside, $0.001721 stands as the major resistance in a meaningful recovery scenario, well above the current price, with $0.002705 relevant only in a substantially larger structural recovery that has not begun to take shape.
Harmony ONE Price Prediction: Two Conditional Paths
Scenario | What It Looks Like |
Relief Bounce Case | Price stabilizes inside the channel and holds above recent lows, with $0.001721 marking genuine recovery progress. |
Continued Breakdown Case | Selling pressure persists, keeping the descending channel intact and putting $0.000374 in focus as the next major support. |
Can Oversold Conditions Offset Exploit-Driven Selling?
As per the CoinGabbar analyst, a confirmed security incident has added fresh, credible uncertainty on top of a downtrend already months in the making, and price has responded with a leg sharp enough to push RSI into deeply oversold territory while longs absorbed most recent liquidations.
Those conditions can create room for a short-term rebound, but neither confirms that the market has fully priced in the incident nor that the broader decline is over, and neither addresses how the market ultimately prices the incident once more details emerge.
Elevated open interest adds another layer of risk, since more leveraged positions on an already volatile setup can amplify moves in either direction.
What We Are Watching Next
Key signals from here: whether Harmony releases further detail on the incident's scope; whether price holds above recent lows; and whether open interest starts unwinding. A failure to hold current levels keeps $0.000374 in play, while stabilization above recent lows would be the first sign selling pressure has eased.
Disclaimer: This article is for informational purposes only and should not be treated as financial advice. Cryptocurrency markets are highly volatile, and prices can change rapidly based on market and security-related developments. Readers should conduct their own research before making any investment decisions.
Also read:

















