Jito Price Prediction: Is JTO Ready for Takeoff?


JTO is doing something it has not managed in weeks. Price is pushing right up against the ceiling that has capped every recovery attempt so far, and buyers finally look like they have something to work with.
This Jito price prediction breaks down whether the current push can turn into a real breakout or whether the descending channel holds one more time.
Why Is JTO Suddenly Moving?
JTO is trading near $0.5580, up a sharp 10.16% over the past 24 hours. That kind of single-day move is enough to pull JTO back into trader conversations after a stretch of underperformance, and it comes with genuine follow-through rather than a brief spike.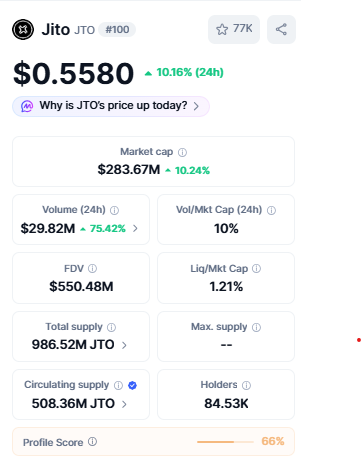
The bigger question this JTO price prediction has to answer is whether that strength can carry the price through resistance that has held for weeks.
Data source: CoinMarketCap
A Quick Look at What Jito Actually Is
Jito operates within the Solana ecosystem and is best known for its MEV infrastructure and liquid staking product, JitoSOL, alongside governance carried out through the JTO token and Jito DAO.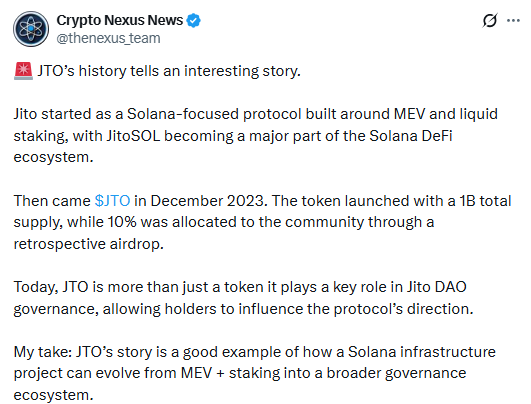
A recent Crypto Nexus News post revisited this history, tracing Jito's growth from a Solana-focused MEV protocol into a broader part of Solana DeFi.
It is background context rather than a new announcement, but it is a useful reminder of why JTO gets attention whenever Solana-related activity picks up.
What Is JTO's Descending Channel Telling Traders?
On the TradingView daily chart, JTO remains inside a descending channel that has defined the trend for weeks.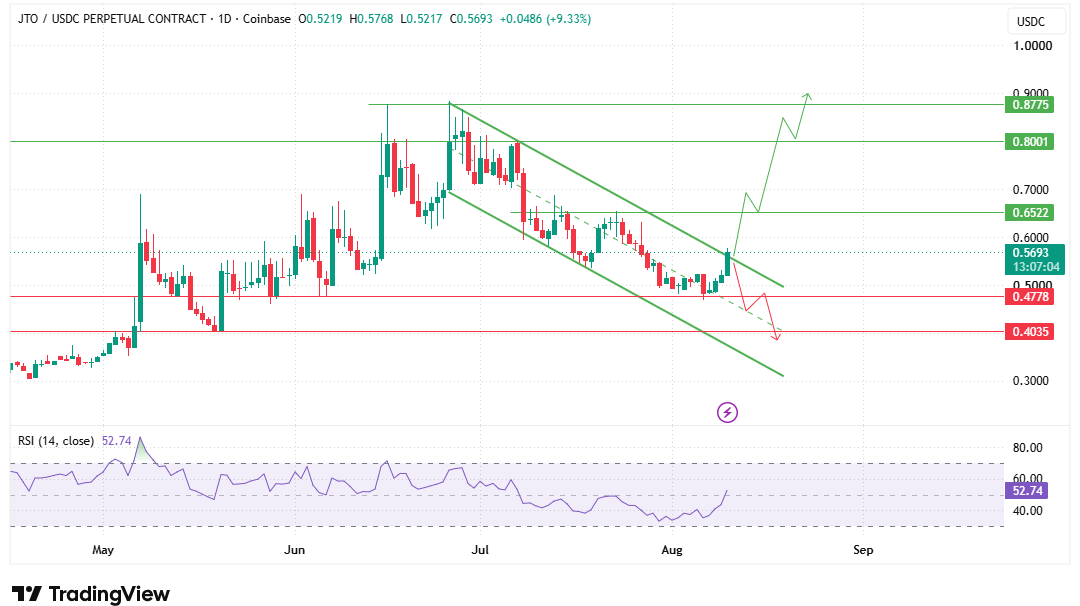
Price has now recovered to the upper boundary of that channel and is testing it directly, which is a meaningfully different position than sitting mid-range.
A confirmed breakout would mean closing above the channel and holding there, not just touching the line intraday.
JTO has not done that yet. It is at the door, not through it.
Daily RSI has moved to 52.74, back above the neutral 50 mark for the first time in a while.
That is a genuine improvement in momentum, though it is far from an overbought or aggressively bullish reading. RSI alone will not confirm a trend reversal here. The channel test still needs to be resolved one way or the other.
Resistance and Support If the Breakout Plays Out
If $JTO clears the descending channel and holds above it, $0.6522 becomes the first meaningful resistance.
Buyers absorbing selling pressure there would shift attention toward $0.8001, and continued strength beyond that zone could bring $0.8775 into view further out.
On the other side, $0.4778 is the first major support if the breakout attempt fails and sellers regain control. Holding that level would keep the broader recovery attempt alive. A decisive break below it would weaken the structure and expose $0.4035.
What Are Futures Traders Actually Doing?
Derivatives activity is fairly broad across venues, with Binance showing roughly $19.41M in futures volume, OKX at $12.39M, and Bybit, WhiteBIT, MEXC, and BingX all contributing smaller but meaningful amounts.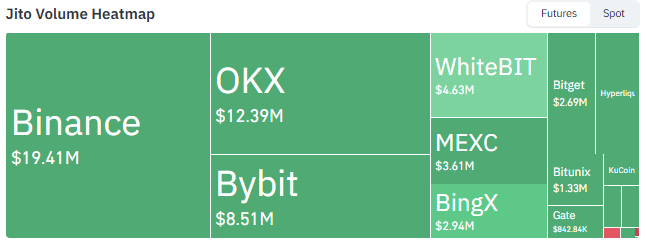
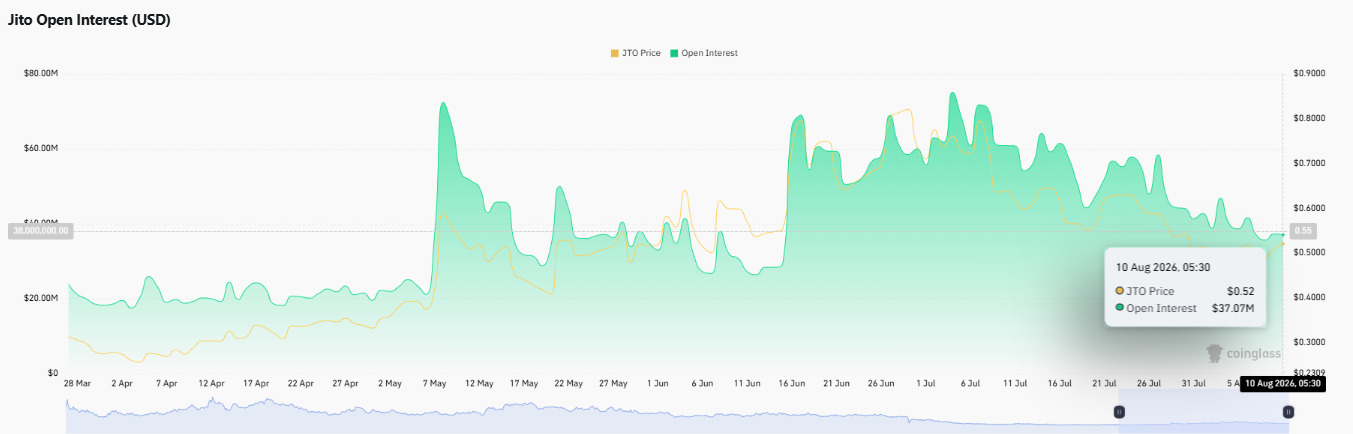
Open interest sits near $37.07M, a level worth watching as supporting context rather than a signal on its own.
The last 24 hours brought $86.53K in total liquidations, with short positions accounting for $70.35K against just $16.18K in long liquidations.
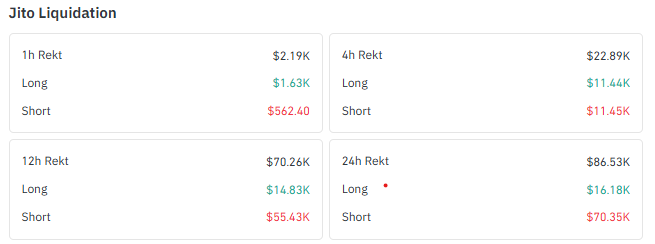
That imbalance lines up with the rally and shows sellers were caught leaning the wrong way as price pushed higher.
Positioning across accounts is where this JTO technical analysis gets more interesting.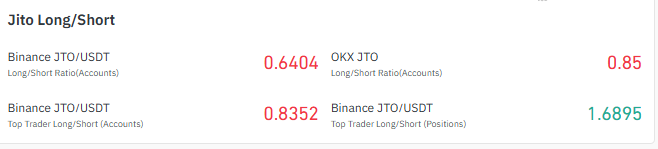
Broader Binance accounts sit at a 0.6404 long/short ratio, Binance top-trader accounts at 0.8352, and OKX accounts at 0.85, all leaning short.
Yet Binance's top trader position size tells a different story at 1.6895, well above 1. In other words, the average account remains cautious, but larger traders are carrying more long exposure by size than their account count would suggest.
That is not unanimous bullishness. It is tension.
Data source: Coinglass
Bull, Neutral, and Bear Scenarios
Bull Case | JTO confirms a breakout above the daily descending channel and sustains outside the structure, bringing $0.6522 into focus first and, on continued strength, $0.8001 and then $0.8775. |
Neutral Case | JTO stalls near the upper channel boundary without a clean breakout, consolidating while RSI holds near or above 50 as traders wait for confirmation either way. |
Bear Case | JTO fails at the channel boundary, and sellers regain control, putting $0.4778 under pressure first, with a break below that level exposing $0.4035. |
JTO Performance Across Timeframes
Short-term momentum has clearly turned, with JTO up 0.63% over the last 4 hours, 11.94% over 24 hours, and 13.65% over the past week.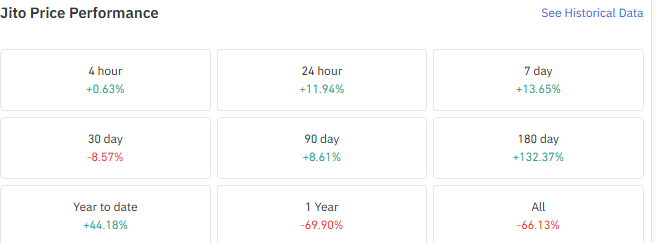
The 180-day window stands out even more sharply at a 132.37% gain, and JTO is up 44.18% year to date.
The picture is not uniformly strong, though. The 30-day return is still negative at -8.57%, and the 1-year performance remains deeply damaged at -69.90%, with the all-time figure down 66.13%. That mix points to a genuine recovery attempt sitting inside a much weaker longer-term trend, not a completed turnaround.
Data source: coinglass
What We're Watching Next
As per Coin Gabbar, analyst $JTO sits at a technically important transition point rather than a confirmed reversal. The descending channel still defines the broader structure, but momentum is improving, with RSI back above neutral and short sellers absorbing the larger share of recent liquidations.
Binance's top trader's position size leaning long while broader account ratios stay cautious adds a layer of nuance rather than a clean bullish signal. A sustained close above the channel would strengthen the recovery case and put $0.6522 in play. Failure to hold that test would put $0.4778 back under pressure, with $0.4035 as the deeper level if selling resumes.
Disclaimer: This article is for informational purposes only and should not be treated as financial or investment advice. Cryptocurrency markets are highly volatile, and prices can move sharply in either direction. Readers should conduct their own research and consult a licensed financial advisor before making any investment decisions. Past performance and technical patterns do not guarantee future results.

















