LAB Price Prediction: Why LAB Price Has Fallen 30% in 24 Hours


$LAB markets itself as a full-service multi-chain trading terminal that allows users to perform spot trades, limit orders, and perpetual futures through a single dashboard on Ethereum, Solana, Base, and BNB Chain.
The AI-powered order routing system and the fixed 0.5% fee system were designed to appeal to active traders who typically switch between various wallets and exchanges.
This strategy, however, has been overshadowed by one of the year’s steepest declines in altcoins for more than a week now.
Traders are now hunting for the next LAB price prediction after the token failed to hold its recovery attempt and slipped further into the weekend.
LAB Price Prediction and Latest Update: Where Does $LAB Stand Now?
LAB is changing hands around $0.8962, down roughly 32.5% in 24 hours, with trading volume near $155M before the token slipped further into the mid-$0.70s.
The broader picture hasn't improved much for holders. The token is still reeling from the crash that erased billions in value earlier this month, when LAB collapsed from levels near $17 to under $2 in a matter of days.
Token unlocks scheduled through July and a much larger cliff unlock expected in mid-August continue to sit over the market as a source of fresh supply, and confidence hasn't meaningfully returned even as the broader crypto market has staged a modest recovery this week.
At current levels, $LAB is trading roughly 97% below its all-time high, and the coin's price action remains far more volatile than the general market, which has been recovering rather than falling over the same period.
Source: Data From CoinMarketCap
LAB Price Prediction and Short-Term Chart Analysis
LAB is trading around $0.7413 on the 1-hour chart right now, down about 30% in the last 24 hr
Price has been sliding inside a descending channel for a while; it breaks down the channel, sweeps the liquidity, and again comes into the channel, and it's now touching the bottom edge of that channel—basically the same story we've seen all week, just at a lower price tag.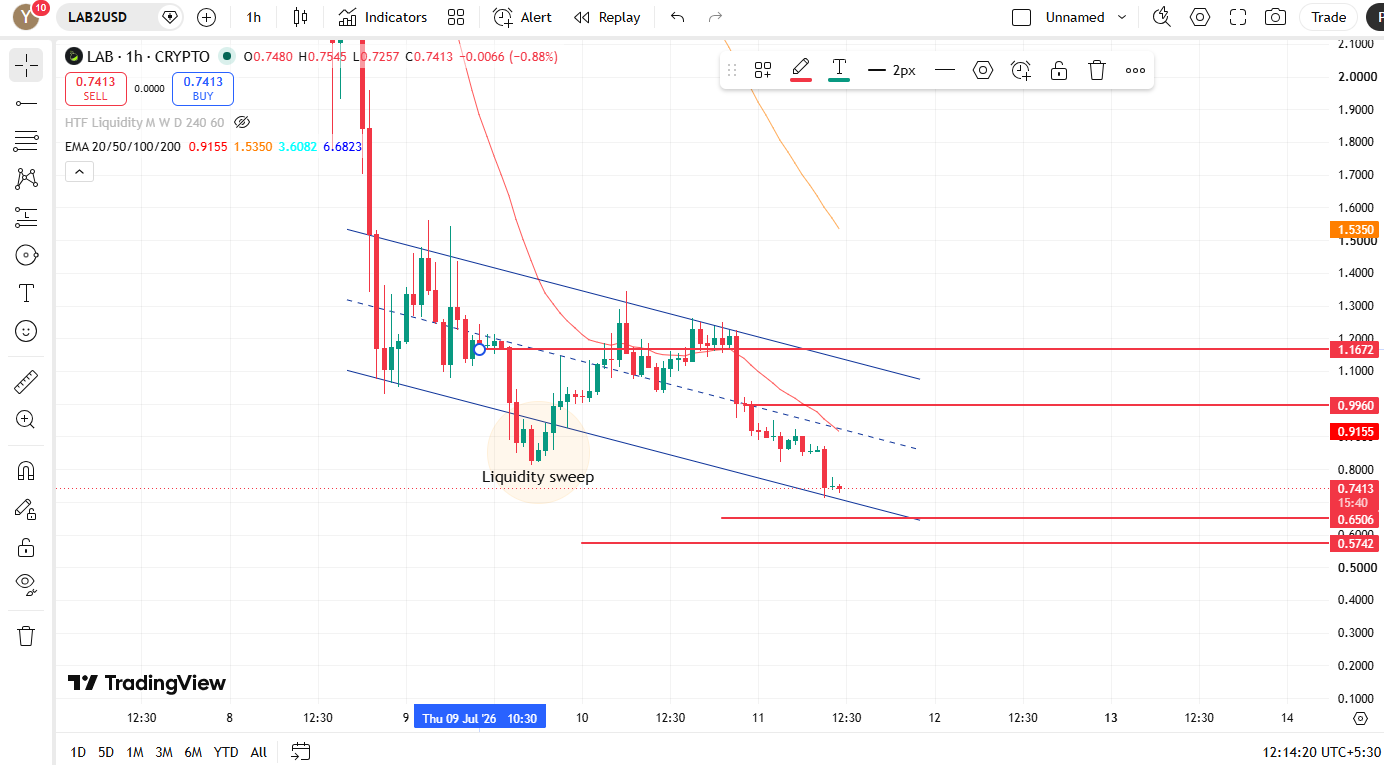
Look at the EMAs, and the picture doesn't get any better: the 20 EMA sits at $0.9155, the 50 EMA at $1.5350, the 100 EMA at $3.6082, and the 200 EMA all the way up at $6.6823.
Liquidity sweep: You'll notice a spot marked on the chart where price wicked down sharply into the $0.95–$1.00 area before snapping straight back up.
That's a liquidity sweep; it's what happens when price dips just below an obvious support zone to trigger stop losses and force leveraged longs out of their positions before reversing hard once that resting liquidity has been "swept" up.
Traders sometimes call this a stop hunt. It doesn't automatically mean a bottom is in, but it does tell you there was real buying interest waiting just below that level, which is worth keeping an eye on if price revisits it.
If buyers can hold this zone and push back above $0.9155 (the 20 EMA), the next hurdle is $0.9960, and beyond that, $1.1672.
If sellers stay in charge and this support gives way, the next stop down is $0.6506, and below that, $0.5742.
Support Levels | Resistance Levels |
$0.6506 | $0.9960 |
$0.5742 | $1.1672 |
The sweep shows some buyers are active, but with every EMA still sitting above price, this isn't a reversal yet; it's just a bounce inside a downtrend. Only a close above the 20 EMA on real volume would change that.
Long-Term Chart Analysis With the LAB Price Prediction
The daily candle shows the token opening near $0.8879, tapping a low of $0.7117, and closing around $0.7413, down 30% in 24 hr.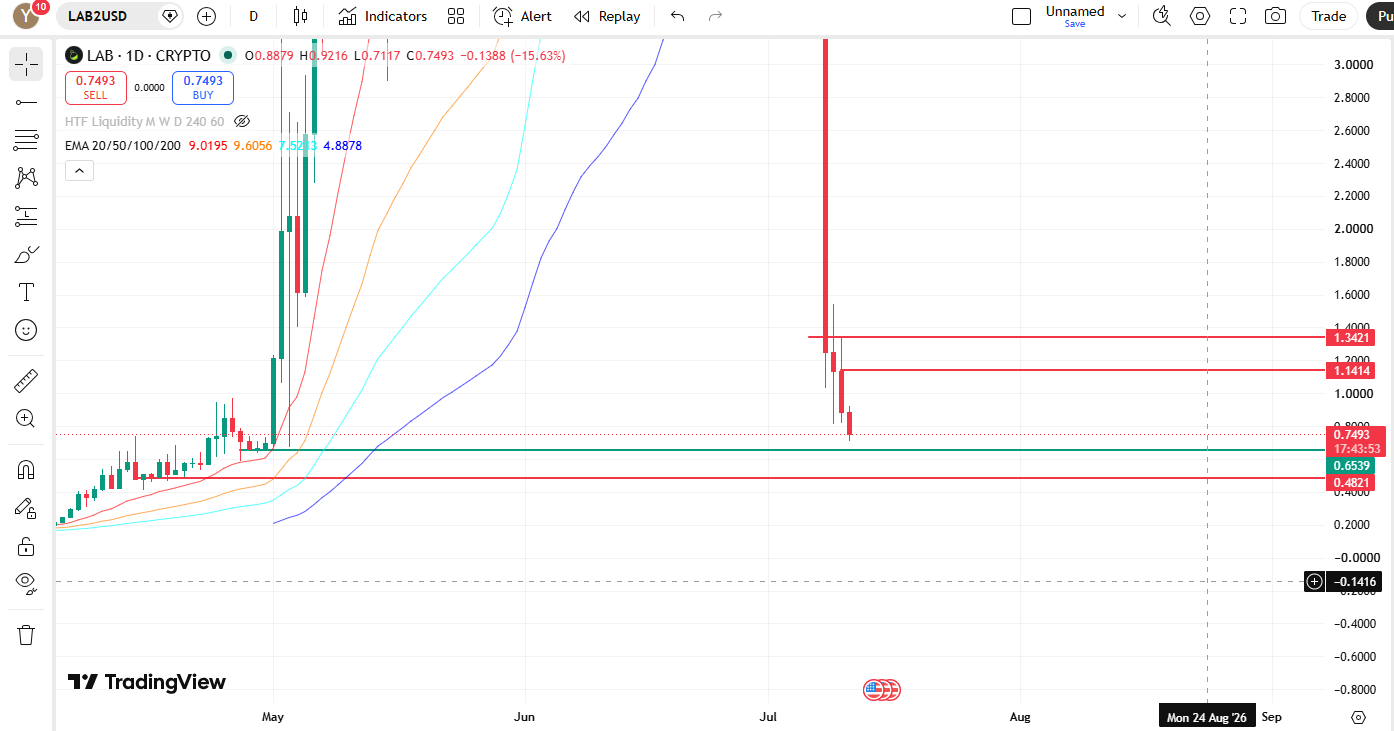
Price is trading well below all four EMAs (20/50/100/200)
The longer-term trend has flipped decisively bearish, and any recovery will have a lot of overhead resistance to chew through before it means much structurally.
Key Levels of $LAB:
Type | Level |
Resistance 1 | $1.1414 |
Resistance 2 | $1.3421 |
Support 1 | $0.6539 |
Support 2 | $0.4821 |
A close back above the $1.14–$1.34 zone would be the first real signal that demand is returning at scale.
Until then, dips toward $0.65 and, if that breaks, $0.48 remain the levels bulls need to watch for any meaningful bounce.
LAB price prediction and Overall Expert View
Right now, the charts still favor the bears. LAB is trading below all major moving averages on both the 1-hour and daily timeframes, which shows that sellers remain in control.
While the recent bounce after the liquidity sweep is a positive sign, it is not enough to confirm that the downtrend has ended.
In the short term, the $0.65 to $0.75 area is the most important support zone. If buyers defend this level and push the price above $0.99, LAB could attempt a recovery toward $1.16-$1.34.
However, if the price falls below $0.65, another move toward $0.57 or even $0.48 cannot be ruled out.
In summary, LAB price forecasting seems to be very conservative.
The prevailing market trend is bearish, and there needs to be a breakout in the near future at least on higher volumes in order to expect the beginning of a reversal.
Disclaimer: This content is for informational purposes only and is not financial advice. Crypto markets are highly volatile; always do your own research before making any investment decisions.
1 week ago
I honestly never expected a YouTube ad to make such a difference in my life. After falling victim to an investment scam, I felt completely lost and didn't know who to trust or what to do next. Then I came across 4victimsbyvictims.org through a YouTube ad. Finding a community of people who had been through the same experience was one of the best things that ever happened to me. They listened, shared practical advice, and helped me understand that I wasn't alone. It gave me a sense of hope and peace I desperately needed. If you're going through something similar, you can reach them at support@4victimsbyvictims.org.

2 months ago
I have been a crab fisherman for 40 years. I started working at a local fish plant a few years ago. I love playing lotto bets, so I buy lotto tickets often but find it difficult to win. I read about Lord Bubuza's lottery spells on the internet, so I contacted him for help to win Lotto 649. He told me that he would need to cast a lotto spell so that he can reveal the lotto numbers I will choose. I was sceptical, but my wife Nancy told me to give it a try. I provided his requirements to cast the lotto spells, and he gave me the numbers. I bought a Lotto 649 ticket and played as Lord Bubuza instructed, to my surprise it was a big win. I won $64,000,000. My partner Nancy and I travelled to the Atlantic Lottery in Moncton to confirm the win and collect the prize. I will retire from my crab fishing with this win and continue to recommend lord Bubuza. Join me and appreciate Lord Bubuza for his help via Email: lordbubuzamiraclework@hotmail.com or WhatsApp: +1 (365) 808 5313 ..
2 months ago
I have been a crab fisherman for 40 years. I started working at a local fish plant a few years ago. I love playing lotto bets, so I buy lotto tickets often but find it difficult to win. I read about Lord Bubuza's lottery spells on the internet, so I contacted him for help to win Lotto 649. He told me that he would need to cast a lotto spell so that he can reveal the lotto numbers I will choose. I was sceptical, but my wife Nancy told me to give it a try. I provided his requirements to cast the lotto spells, and he gave me the numbers. I bought a Lotto 649 ticket and played as Lord Bubuza instructed, to my surprise it was a big win. I won $64,000,000. My partner Nancy and I travelled to the Atlantic Lottery in Moncton to confirm the win and collect the prize. I will retire from my crab fishing with this win and continue to recommend lord Bubuza. Join me and appreciate Lord Bubuza for his help via Email: lordbubuzamiraclework@hotmail.com or WhatsApp: +1 (365) 808 5313 ...
2 months ago
I have been a crab fisherman for 40 years. I started working at a local fish plant a few years ago. I love playing lotto bets, so I buy lotto tickets often but find it difficult to win. I read about Lord Bubuza's lottery spells on the internet, so I contacted him for help to win Lotto 649. He told me that he would need to cast a lotto spell so that he can reveal the lotto numbers I will choose. I was sceptical, but my wife Nancy told me to give it a try. I provided his requirements to cast the lotto spells, and he gave me the numbers. I bought a Lotto 649 ticket and played as Lord Bubuza instructed, to my surprise it was a big win. I won $64,000,000. My partner Nancy and I travelled to the Atlantic Lottery in Moncton to confirm the win and collect the prize. I will retire from my crab fishing with this win and continue to recommend lord Bubuza. Join me and appreciate Lord Bubuza for his help via Email: lordbubuzamiraclework@hotmail.com or WhatsApp: +1 (365) 808 5313 ...
2 months ago
I have been a crab fisherman for 40 years. I started working at a local fish plant a few years ago. I love playing lotto bets, so I buy lotto tickets often but find it difficult to win. I read about Lord Bubuza's lottery spells on the internet, so I contacted him for help to win Lotto 649. He told me that he would need to cast a lotto spell so that he can reveal the lotto numbers I will choose. I was sceptical, but my wife Nancy told me to give it a try. I provided his requirements to cast the lotto spells, and he gave me the numbers. I bought a Lotto 649 ticket and played as Lord Bubuza instructed, to my surprise it was a big win. I won $64,000,000. My partner Nancy and I travelled to the Atlantic Lottery in Moncton to confirm the win and collect the prize. I will retire from my crab fishing with this win and continue to recommend lord Bubuza. Join me and appreciate Lord Bubuza for his help via Email: lordbubuzamiraclework@hotmail.com or WhatsApp: +1 (365) 808 5313 ..
2 months ago
I have been a crab fisherman for 40 years. I started working at a local fish plant a few years ago. I love playing lotto bets, so I buy lotto tickets often but find it difficult to win. I read about Lord Bubuza's lottery spells on the internet, so I contacted him for help to win Lotto 649. He told me that he would need to cast a lotto spell so that he can reveal the lotto numbers I will choose. I was sceptical, but my wife Nancy told me to give it a try. I provided his requirements to cast the lotto spells, and he gave me the numbers. I bought a Lotto 649 ticket and played as Lord Bubuza instructed, to my surprise it was a big win. I won $64,000,000. My partner Nancy and I travelled to the Atlantic Lottery in Moncton to confirm the win and collect the prize. I will retire from my crab fishing with this win and continue to recommend lord Bubuza. Join me and appreciate Lord Bubuza for his help via Email: lordbubuzamiraclework@hotmail.com or WhatsApp: +1 (365) 808 5313
2 months ago
How to Hire a Hacker to Recover Stolen Bitcoin ; META TECH RECOVERY PRO Top Crypto Recovery Expert in USA Meta Tech Recovery Pro was founded to help victims of crypto theft, cryptocurrency scams, and wallet loss recover their digital assets. We recognize that being defrauded is often accompanied by stress, uncertainty, and long-term disruption, and we approach each case with seriousness, discretion, and measurable progress. Our team combines experienced crypto recovery professionals with blockchain forensics specialists. Using systematic analysis of transaction histories, blockchain patterns, and relevant on-chain and off-chain activity, we trace where stolen funds moved, how wallet access was compromised, and what technical pathways may support restoration. This may include tracing suspicious transfers, mapping associated addresses, evaluating links to exchanges or custodial services, and determining recovery options based on the incident’s specific facts. Reach out to them via the following: - Support (@) metatechrecoverypro (.) com - https://wa.link/5ay4fv - - https://metatechrecoverypro (.) com We emphasize legitimacy, transparency, and responsible practice. Effective recovery requires both technical capability and ethical standards; therefore, we use structured procedures rather than unverifiable promises. We provide victims with clarity on what can be pursued and realistic outcomes, guided by evidence rather than marketing claims. Our services cover: - Lost access to a Bitcoin wallet (forgotten credentials, missing seed phrases, compromised devices, inaccessible keys). - Fraud from romance scams, where attackers manipulate victims into sending cryptocurrency while sustaining deceptive trust. - Defrauding via counterfeit or fake investment platforms, including impersonation of legitimate projects, promises of high returns, and deceptive withdrawal of funds. Timely action is critical, as crypto transactions are often irreversible and stolen funds may be quickly dispersed or converted. We encourage victims to document wallet addresses, transaction IDs, dates, communications, and any platform or contact information as early as possible to enable efficient forensic assessment. Our approach is comprehensive, considering how fraud operates, including tactics used to obscure fund flows, exploit wallet vulnerabilities, or socially engineer victims into approving transfers. By evaluating both behavioral and technical dimensions, we improve the likelihood of locating actionable leads and selecting the most appropriate recovery strategy. Recovery also requires accountability, confidentiality, and a patient, methodical mindset. Whether assets were taken through hacking, misdirection, manipulation, or wallet access loss, our team investigates thoroughly and guides you through the recovery process with professionalism. Meta Tech Recovery Pro is committed to helping victims reclaim what was taken, restore control where possible, and provide informed support throughout a challenging experience.
2 months ago
How to Hire a Hacker to Recover Stolen Bitcoin ; META TECH RECOVERY PRO Top Crypto Recovery Expert in USA Meta Tech Recovery Pro was founded to help victims of crypto theft, cryptocurrency scams, and wallet loss recover their digital assets. We recognize that being defrauded is often accompanied by stress, uncertainty, and long-term disruption, and we approach each case with seriousness, discretion, and measurable progress. Our team combines experienced crypto recovery professionals with blockchain forensics specialists. Using systematic analysis of transaction histories, blockchain patterns, and relevant on-chain and off-chain activity, we trace where stolen funds moved, how wallet access was compromised, and what technical pathways may support restoration. This may include tracing suspicious transfers, mapping associated addresses, evaluating links to exchanges or custodial services, and determining recovery options based on the incident’s specific facts. Reach out to them via the following: - Support (@) metatechrecoverypro (.) com - https://wa.link/5ay4fv - - https://metatechrecoverypro (.) com We emphasize legitimacy, transparency, and responsible practice. Effective recovery requires both technical capability and ethical standards; therefore, we use structured procedures rather than unverifiable promises. We provide victims with clarity on what can be pursued and realistic outcomes, guided by evidence rather than marketing claims. Our services cover: - Lost access to a Bitcoin wallet (forgotten credentials, missing seed phrases, compromised devices, inaccessible keys). - Fraud from romance scams, where attackers manipulate victims into sending cryptocurrency while sustaining deceptive trust. - Defrauding via counterfeit or fake investment platforms, including impersonation of legitimate projects, promises of high returns, and deceptive withdrawal of funds. Timely action is critical, as crypto transactions are often irreversible and stolen funds may be quickly dispersed or converted. We encourage victims to document wallet addresses, transaction IDs, dates, communications, and any platform or contact information as early as possible to enable efficient forensic assessment. Our approach is comprehensive, considering how fraud operates, including tactics used to obscure fund flows, exploit wallet vulnerabilities, or socially engineer victims into approving transfers. By evaluating both behavioral and technical dimensions, we improve the likelihood of locating actionable leads and selecting the most appropriate recovery strategy. Recovery also requires accountability, confidentiality, and a patient, methodical mindset. Whether assets were taken through hacking, misdirection, manipulation, or wallet access loss, our team investigates thoroughly and guides you through the recovery process with professionalism. Meta Tech Recovery Pro is committed to helping victims reclaim what was taken, restore control where possible, and provide informed support throughout a challenging experience.
2 months ago
In today's digital world, cyber threats are becoming increasingly sophisticated, placing businesses and individuals at greater risk than ever before. At MUYERN TRUST HACKER, we are dedicated to helping our clients protect what matters most through professional cybersecurity services, advanced digital investigations, and security consulting tailored to modern challenges. Established in 1998, MUYERN TRUST HACKER has built a reputation for delivering reliable cybersecurity solutions with discretion, professionalism, and technical expertise. Our team works with organizations and private clients worldwide, providing strategic guidance and practical solutions designed to strengthen digital security and reduce cyber risk. Our expertise covers a broad range of cybersecurity services, including digital forensics, cloud security consulting, cyber incident response, security assessments, cyber awareness guidance, and digital asset recovery support for legitimate cases involving online fraud or unauthorized transactions. Every engagement begins with understanding the client's unique situation. We believe there is no one-size-fits-all approach to cybersecurity, which is why every solution we provide is carefully planned to meet individual business or personal security requirements. Confidentiality, integrity, and transparency remain at the core of everything we do. As technology continues to evolve, so do cyber threats. MUYERN TRUST HACKER remains committed to staying ahead of emerging risks by applying proven methodologies, continuous research, and industry best practices to deliver dependable security services for clients around the globe. Whether you require proactive cybersecurity planning, assistance following a cyber incident, or professional digital investigations, our team is ready to help you move forward with confidence. Our Professional Services Cybersecurity Consulting Phone/Email Hacks School grade Upgrade Cloud Security Solutions Digital Asset Recovery Serving Clients Worldwide Website: (http://www.muyerntrust.com) Email: muyerntrusted(@)mail-me(.)com Whats App:* +1 2.0.2. 7.0.3 2.2.3.9 *Established 1998*
2 months ago
Techy Force Cyber Retrieval was founded with a single purpose: to give victims of crypto fraud a fighting chance. As digital assets revolutionize the global economy, they have also opened the door to new forms of fraud and deception. Every day, individuals and organizations lose millions to scams, hacks, and fraudulent schemes, with little recourse or guidance on what to do next. support@techyforcecyberretrievals.com We saw the gap, and we stepped in to close it. Techy Force Cyber Retrieval Expert brings together blockchain experts, forensic analysts, cybersecurity professionals, and legal partners from around the world—all united by a commitment to justice in the digital age. We use advanced blockchain forensics and global investigative techniques to trace stolen assets, identify perpetrators, and help victims recover what is rightfully theirs. We envision a world in which blockchain is a space of transparency, accountability, and trust—not fear. We aim to be the leading global force in crypto investigation and recovery, setting the standard for how digital crimes are pursued and prosecuted. Through innovation, collaboration, and relentless investigation, we aim to restore confidence in crypto and empower those affected by fraud. support@techyforcecyberretrievals.com We do not just investigate. We advocate. We fight for justice. And we help people take back control. With Top Recovery Expert, crypto fraud doesn't have to be the end of the road. It is where our investigation begins.

















