- News
- Price Prediction
- Press Release
- Crypto Airdrop ›
- Presale / ICO ›
- Events
- Listing
- Tools ›
- Casino ›
-

MOG Coin (MOG) recently experienced notable volatility in its price action, following a strong surge earlier in the day. The cryptocurrency reached a high of approximately $0.0001475 but has since pulled back below the $0.000135 mark, indicating a period of market correction.
This sharp dip represents a retracement after a steep upward swing, signaling some short-term consolidation or a temporary reversal in price.
A 6.9% shrink has been witnessed in the 24-hour timeframe for the meme coin,, giving it a short-term bearish sentiment. On the plus side, there has been a seeming uptrend during the week, with a slight 3.5% gain, hinting that in longer term, the market remains relatively favorable.
Provided that the recent fall did happen, there is the likelihood that the token will still be above its recent support areas. This would provide potential support where it might try to stabilize or ascend.
Meanwhile, technical indicators offer further insight into the market’s behavior. Analyst Ali Martinez considers the recent dip as a potential buying opportunity.
Source: X
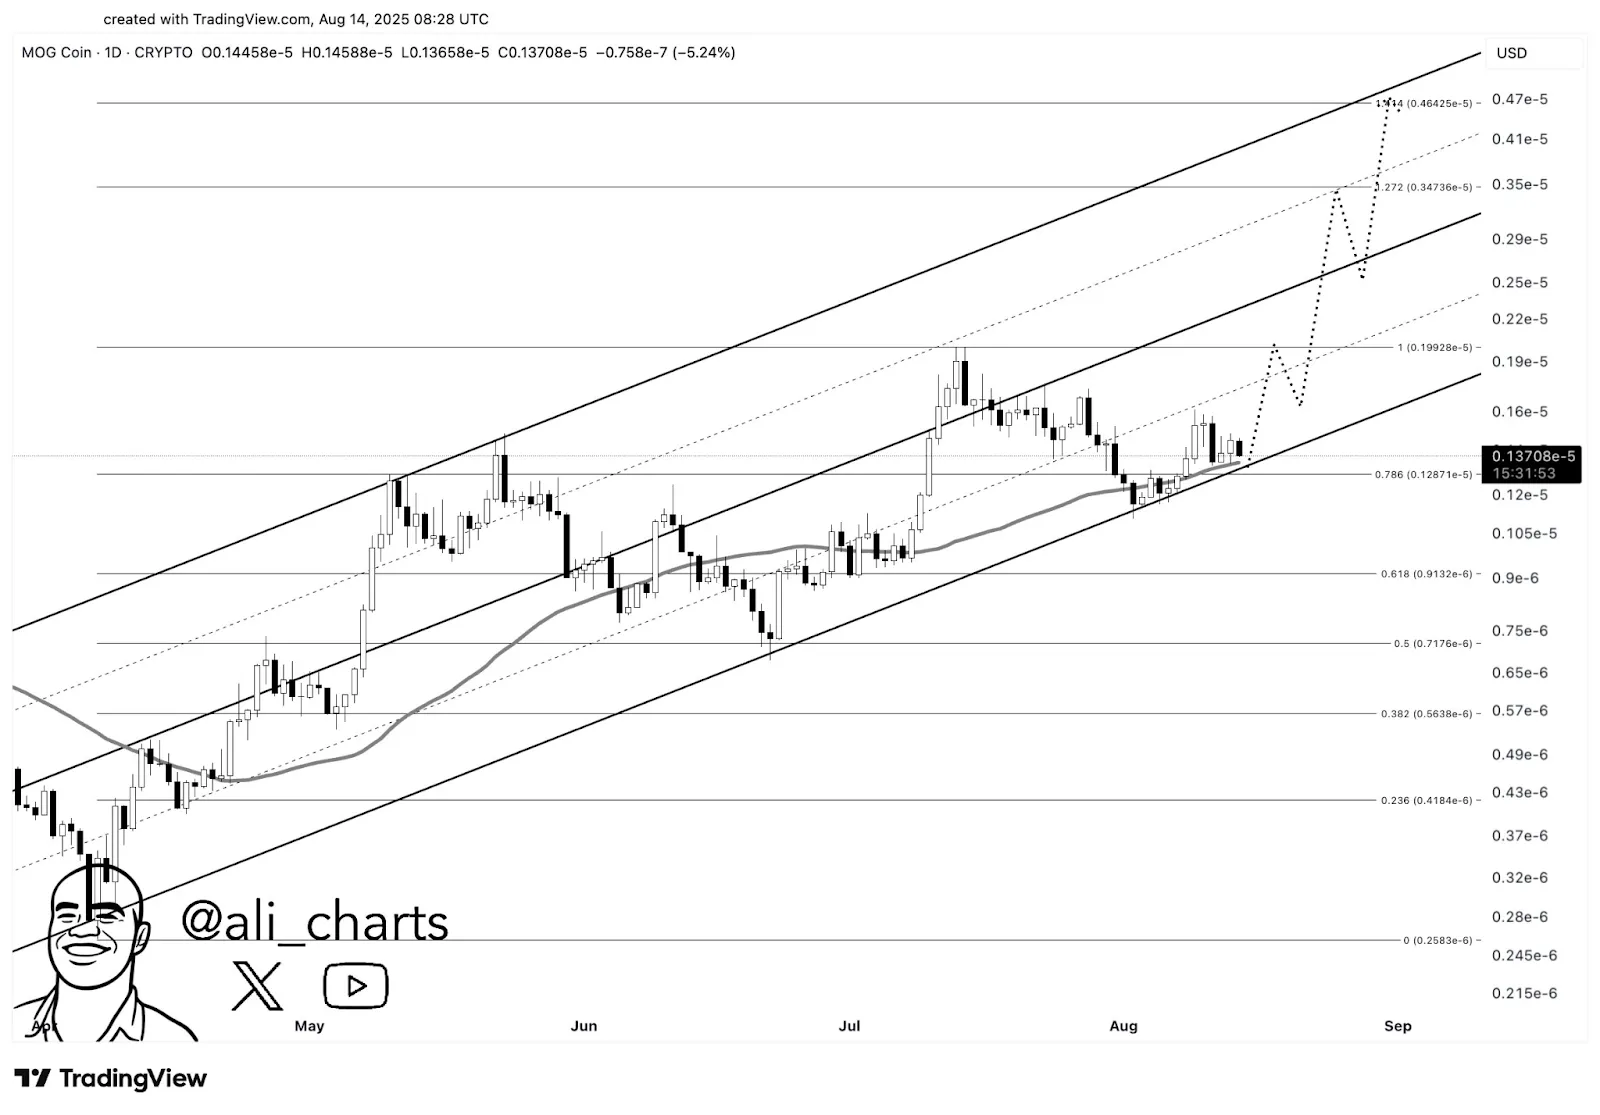
He noted that the meme coin tested the important support near 0.786 Fibonacci retracement level of about $0.0000012892, an area which in the past potently capitulated toward price reversals, and any recent bounce from it should therefore be taken with hope for a recovery rally.
The chart showed MOG price within an ascending channel, which has provided consistent support and resistance levels. The recent bounce off the 0.786 Fibonacci level supports the idea that the coin could recover towards the upper boundary of the channel.
According to the analyst, this provides an opportunity for traders to aim for an upward movement to $0.0000046239, implying a 3.6x jump from the current price levels.
The token remains above the main 0.5 Fibonacci retracement level at $0.0000016146, which further goes to support the bullish view. This level has supported the token in previous price cycles and will need to maintain this so the coin can climb further over the next days.
While there is a potential for recovery, technical indicators give a more cautious view. The relative strength index stands at 45.28, which is neutral, indicating that the market is neither overbought nor oversold at this time. It could suggest consolidation before a more decisive movement of the price.
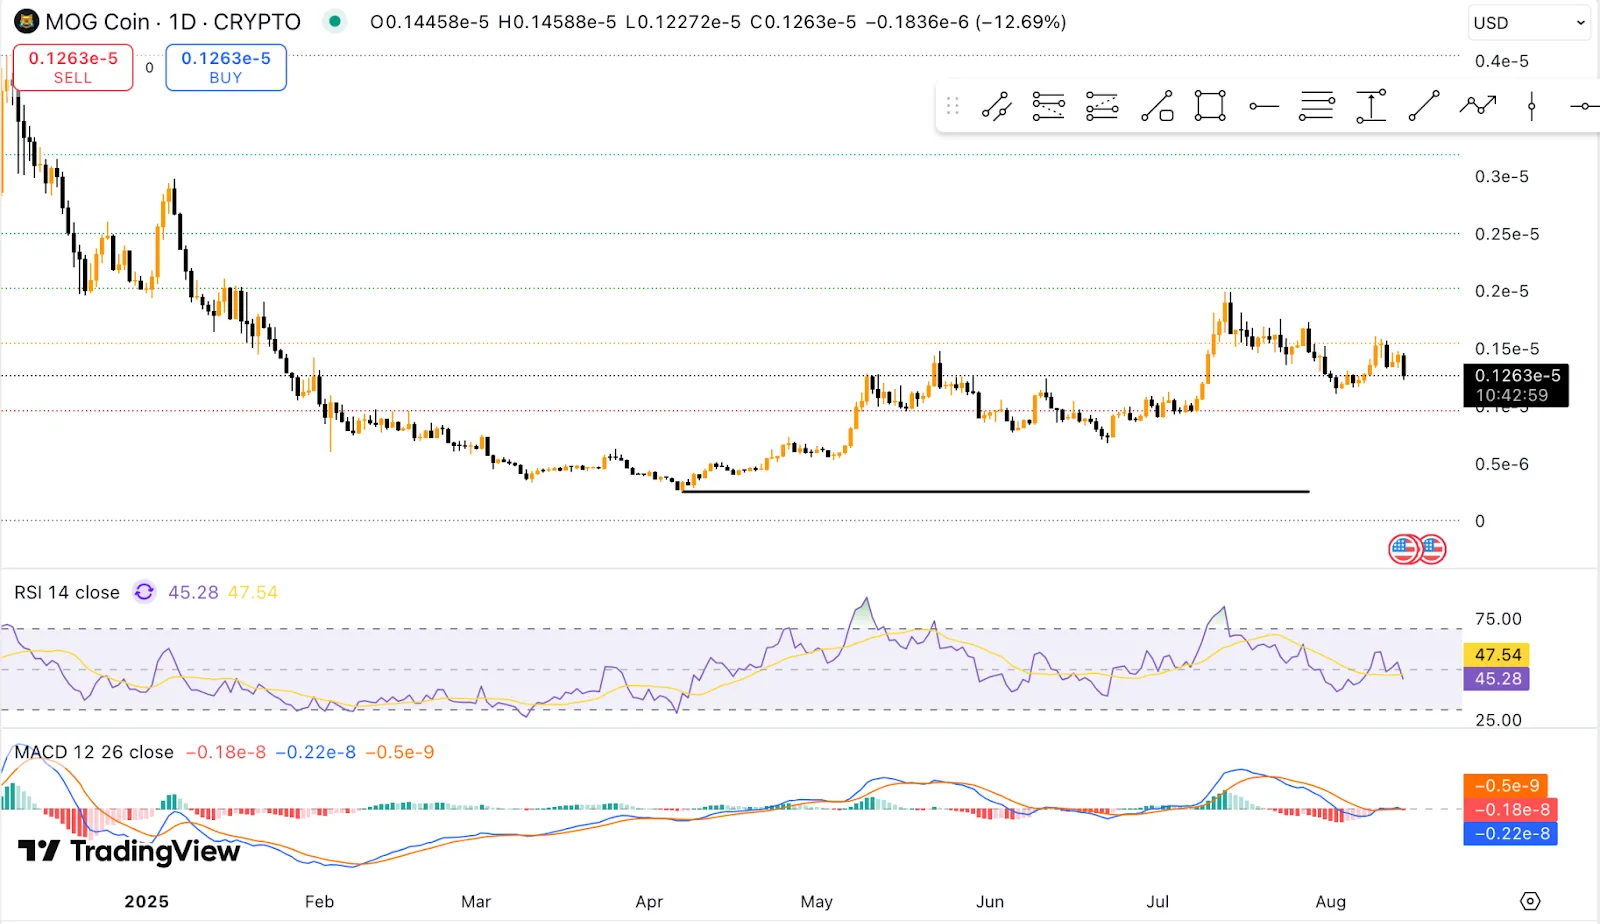
Source: TradingView
Furthermore, the moving average convergence divergence indicator shows a weak short-term momentum after the MACD line crossed below the signal line. This signaled the possibility of the bearish momentum starting.
Nonetheless, a full bearish crossover is still ahead for the MACD, and in case the price recovers from here, the meme coin could see a reversal of momentum. Traders will be carefully watching these indicators, as a potential reversal could result in renewed investor interest.
Owned by:-
DCG Tech FZCO, UAE
Delivery Partner:-
Gabbar MediaTech Pvt Ltd.
Copyright © 2026 Coin Gabbar. All Rights Reserved


