Don't Miss! Whale’s 14M In, But Where is Move: Monero Price Prediction


Monero is trending again, and traders are watching every move on the chart.
XMR broke through a key resistance zone this week, and buyers pushed the price higher fast. The coin is now holding near its highest level in months after that breakout.
This Monero Price Prediction looks at the resistance break, the EMA levels, the RSI reading, and the key support zones that could decide where XMR goes from here.
Monero is a privacy-focused cryptocurrency, according to the project's own materials. Stick around, because the levels ahead could matter a lot for what happens next.
Market data was checked on August 13, 2026, at 14:17 IST.
Monero Price Prediction Today: Market Overview
Metric | Value |
Price | $402.09 |
24h Change | +2.40% |
Market Cap | $7.55B |
FDV | $7.55B |
24h Volume | $74.54M |
Vol/Mkt Cap (24h) | 0.984% |
Total Supply | 18.79M $XMR |
Max Supply | Unlimited |
Circulating Supply | 18.79M $XMR |
Rank | #13 |
Source: Data from CoinMarketCap as of August 13, 2026, at 14:17 IST. Figures may vary slightly across other tracking websites.
Monero Price Prediction Chart: Technical Analysis
Pair: XMR/USD · Market: Spot (Crypto) · Timeframe: Daily · Source: TradingView · Timestamp: August 13, 2026, 14:17 UTC+5:30
Monero is trading at $402.09, after breaking above the $376.04 level that had been held as resistance for several days.
Price is now sitting just above that old resistance zone, which should act as support going forward if the move holds.
Both EMAs sit well below the current price, at EMA (20) $371.80 and EMA (50) $356.34, which shows the short-term trend has turned up.
The RSI sits at 66.85 on the daily chart. This is a strong reading and shows buyers are in control right now.
It is not yet in the overbought zone above 70, which is the level that often comes before a pullback.
The price remains in an uptrend as long as it trades above the current support level and continues to form higher highs. 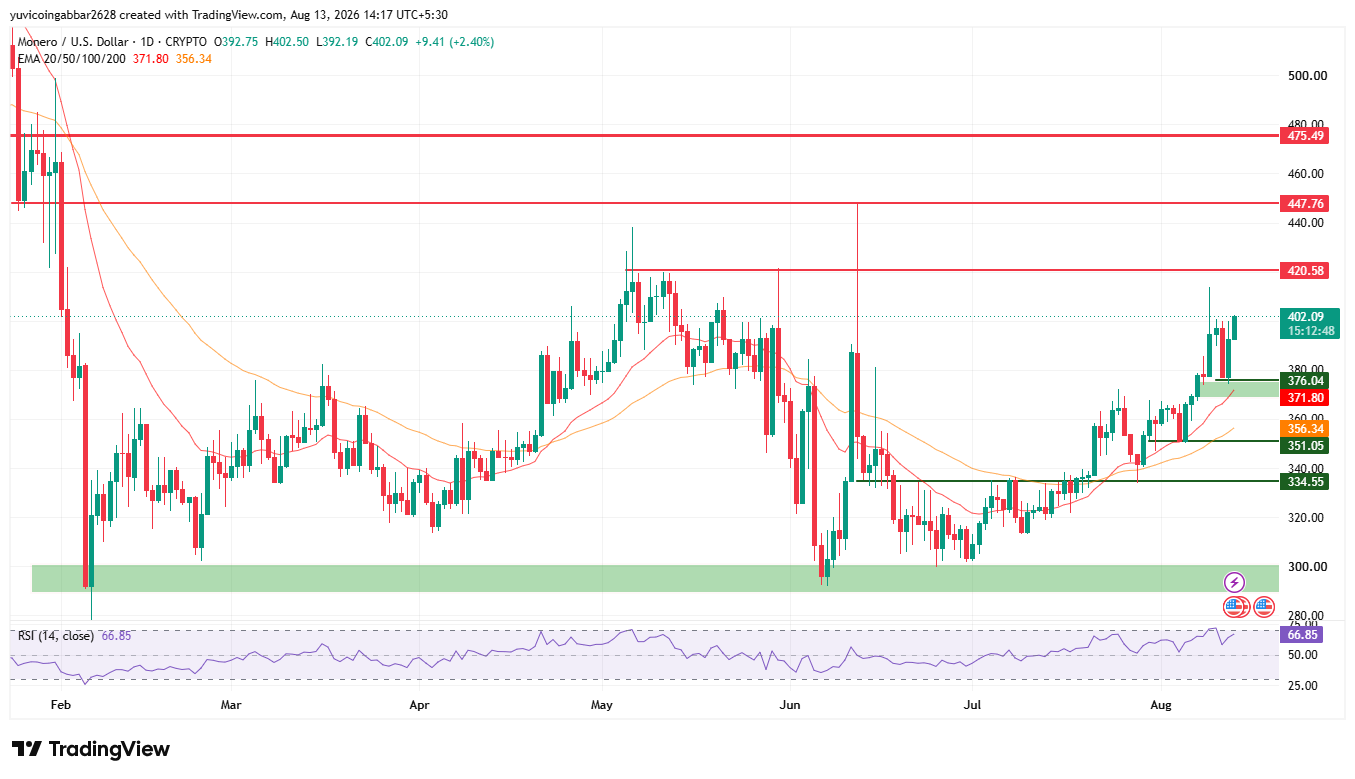
Support and Resistance Levels
Level Type | Price |
Resistance 3 | $475.49 |
Resistance 2 | $447.76 |
Resistance 1 (nearest) | $420.58 |
Immediate Price Reference | $402.09 |
First Support | $376.04 |
Deeper Support | $351.05 |
Structural Floor | $334.55 |
EMA Levels
EMA | Price |
EMA (20) | $371.80 |
EMA (50) | $356.34 |
XMR Price Scenarios: Triggers and Invalidation
Scenario | Trigger | Likely Outcome | Invalidation Point |
Channel breakout | Close above $420.58 | Move toward $447.76, then $475.49 | Rejection back below $420.58 |
Channel hold | Price stays between $376.04 and $420.58 | Choppy, range-bound trading | Break of either boundary |
Channel breakdown | Close below $376.04 | Move toward $351.05, then $334.55 | Reclaim of $376.04 |
Monero Forecast: Bull Case vs Bear Case
$Monero price target 2026 Bull case: Holding above the old resistance zone at $376.04 and pushing through $420.58 would keep the current uptrend going.
A confirmed break above $420.58 would open the path toward $447.76 and then $475.49.
$Monero price target 2026 Bear case: A drop back below $376.04 would put the breakout in doubt and suggest the move was a fast spike rather than a real trend change.
Losing the EMA support near $371.80 and $356.34 would expose $351.05 and then $334.55 as the next levels down.
$Monero Price Target: Can $Monero Reach $475.49?
$475.49 is the highest resistance level marked on the chart. Getting there would need XMR to first clear $420.58, then hold above $447.76, before making one more push higher.
This is a multi-step move, not a single leg up.
What Could Invalidate the Bullish Setup?
A rejection at $420.58 followed by a close back below $376.04 would put the breakout in question.
A deeper drop below $351.05 and then $334.55 would undo most of the recent gains and point to a weaker trend.
Monero Price Prediction: Expert View
According to CoinGabbar analysts, the resistance break and the strong RSI reading point to buyers being in control right now.
XMR broke through a level that had held for weeks, and it did so with real strength behind the move, not a small, quiet push.
The $376.04 to $420.58 zone is the area to watch most closely.
Holding above $376.04 keeps the uptrend story alive, while losing it would suggest the breakout was a short-lived spike rather than a real shift in trend.
Disclaimer
This piece is for informational purposes only and isn't financial advice. The levels and scenarios above are based on technical chart analysis and publicly available data at the time of writing, and crypto markets can move sharply within hours, so past patterns don't guarantee future outcomes. It's worth doing independent research and considering your own risk tolerance before acting on any of the levels discussed here.
Also read:

















